
the full pdf for this article can be found here
Funded by the Convergence Partnership Fund of the Tides Foundation and private donations to the Community Food Security Coalition
Funded by Kaiser Permanente, WK Kellogg Foundation, Robert Wood Johnson Foundation, Nemours, Kresge Foundation, Center for Disease Control, and The California Endowment.
ACKNOWLEDGEMENTS
The authors of this report are grateful to the Healthy Eating Active Living (HEAL) Convergence Partnership for funding this project, and to Shireen Malekafzali and Mary Lee of PolicyLink.
This report would not have been possible without the support, time, and encouragement provided by the members of the Farmers Market SNAP Advisory Group. The Advisory Group met via conference calls between October 2009 and March 2010 to share input and expertise based on their experiences with SNAP in farmers markets in communities nationwide. These advisors included:
Alex Ashbrook (DC Hunger Solutions, Washington, DC)
Joanne Berkenkamp (Institute for Agriculture & Trade Policy, Minneapolis, MN)
Fred Broughton (South Carolina Association of Farmers Markets, SC)
Iva Denson (Choctaw Nation, OK)
Diane Eggert (Farmers Market Federation of New York, Fayetteville, NY)
Amy Gilroy (Community Health Partnership, Oregon’s Public Health Institute, Portland, OR) Jon Glyn (The Food Trust, Philadelphia, PA)
Alan Hunt (Local Food Strategies, Washington, DC)
Preston Maring (Kaiser Permanente, Oakland, California)
Kristen Roberts, (DC Hunger Solutions, Washington, DC)
Leslie Schaller (Appalachian Center for Economic Networks, Athens, OH)
August Schumacher (Wholesome Wave Foundation)
Andrew Smiley (Sustainable Food Center, Austin, TX)
Juliette Taylor-Devries (Wholesome Wave Foundation, Westport, CT)
Nicky Uy (The Food Trust, Philadelphia, PA)
Ellen Vollinger (Food Research Action Center, Washington DC)
Jan Walters (Iowa Department of Human Services, Des Moines, IA)
Kelly Williams (Project for Public Spaces, New York, NY)
Darlene Wolnik (marketumbrella.org, New Orleans, LA)
Sharon Yeago (Farmers Market Coalition, High Springs, FL)
In addition, the authors wish to extend a special thanks to USDA staff who provided data and insight about their programs, including Carolyn Foley, Susan Modine, and Ron Gwinn of the USDA Food and Nutrition Service, Lucas Knowles of the Office of the Secretary (USDA), as well as Errol Bragg, Carmen Humphrey, Debra Tropp, Alicia Bell-Sheeter, and Wendy Wasserman of the USDA Agricultural Marketing Service.
The authors wish to extend a special thanks to the many farmers markets, state SNAP agencies, and other organizational leaders who were interviewed in the course of this project. Please see References for a complete list of these individuals. Helen Dombalis and Nell Tessman provided editing assistance. The report was designed by Rebecca Mann.
REAL FOOD, REAL CHOICE
TABLE OF CONTENTS
Executive Summary . . . . . . . . . . . . . . . . . . . . . . . . . . . . . . . . . . . . . . . . . . . . . . . . . . . . . . . . . . . . . . . . . . iv
Chapter I
Chapter II
Chapter III
Chapter IV
Chapter V
Chapter VI
Chapter VII References……………………………………………………………… 48 ResearchContacts………………………………………………………… 54 Appendices . . . . . . . . . . . . . . . . . . . . . . . . . . . . . . . . . . . . . . . . . . . . . . . . . . . . . . . . . . . . . . . . . . . . . . . . 56
Introduction……………………………………………………1 IntroductiontoFarmersMarketsandtheSNAPProgram………………………….. 5 SNAPRecipientPerspective…………………………………………12 TheFarmersMarketViewofSNAPTransactions………………………….22 TheRoleofStateandLocalLeadershipinFosteringSNAPUsageatFarmersMarkets………….29 ThePolicyContext–Programs,CurrentEvents,andFutureRecommendations ……………… 34 RoadMapforChange…………………………………………… 42
CONNECTING SNAP RECIPIENTS WITH FARMERS MARKETS
iii
iv
EXECUTIVE SUMMARY
INTRODUCTION
Farmers markets are experiencing a resurgence, increasingly recognized as important hubs for local food systems in the United States. In the last 15 years, the number of garcinia cambogia farmers markets in the United States has increased from 1,755 to 5,274; however, low-income communities have not fully participated in this upward trend. This is especially problematic in light of health disparities faced by im- poverished communities and communities of color, which is in part aggravated by a lack of access to fresh fruits and vegetables. Farmers markets can play an important role in improving such access. Low- resource communities not only provide unique opportunities for direct marketing producers, but also substantial economic, social, and at times cultural barriers to the successful operation of farmers markets.
One such barrier has been the transfer of food stamps (now known as SNAP or Supplemental Nutrition Assistance Program) from a paper coupon to a debit card format. Between 1994, before this change started to take place, and 2008, the value of SNAP benefits redeemed at farmers markets dropped by 71% in constant 1994 dollars. All told, SNAP transactions at farmers markets accounted for a mere 0.008% of total SNAP transactions nationwide in 2009. By way of comparison, USDA estimates that American consumers spend roughly 0.2% of their food dollars at farmers markets.
METHODOLOGY
This report is a product of a ten month process that examines this issue from a variety of perspectives, including the capacity of farm- ers markets to operate programs to accept EBT (electronic benefits transfer) cards; the types of programs that markets have created; the barriers low-income shoppers face in patronizing farmers markets; and state and federal level policies that affect the usage of EBT cards at farmers markets. The report concludes with a road map for change, which features primary and secondary tiers of recom- mendations.
The research process included literature reviews, surveys, and phone interviews. The report reflects a spectrum of state-level stakeholders including SNAP agencies, anti-hunger advocates, statewide farmers market associations, and state departments of agriculture. Much of the research was concentrated on 15 states, some at the vanguard of this issue, and some lacking leadership capacity altogether. Each of these states, however, is in one way or another representative of the myriad of challenges and potential solutions.
MAJOR FINDINGS OF THE REPORT INCLUDE:
• Farmers markets have modest and uneven staffing and finan- cial capacity to handle the time consuming and potentially costly requirements of being SNAP vendors. EBT terminals can be expensive, and managing alternative currency programs can be labor intensive. Many markets just cannot handle the extra burden required of them in this area. However, improved technology and reduced costs render technology increasingly less problematic.
• Successful EBT models have been developed that can over- come the challenges if the shoppers, farmers, and market man- agers can accommodate some measure of inconvenience. These models need to be tailored to the capacities and needs of each market.
• Many SNAP shoppers are not aware of the existence of farm- ers markets, or that they accept EBT cards. When they are aware, numerous other barriers still exist for SNAP partici- pants to shop at farmers markets, including cultural or lan- guage obstacles, inconvenient hours, product mix, transpor- tation, and the perception that market prices are higher than in supermarkets.
• Incentive programs such as the WIC Farmers Market Nutri- tion Program (FMNP) and the Senior FMNP have been criti- cal to the success of operating markets in low-income com- munities. More recently, bonus programs, such as those fund- ed by Wholesome Wave Foundation, have shown great prom- ise in effectively drawing SNAP shoppers to farmers markets.
• Nationally, there is an historic opportunity to connect nutri- tion policy and agriculture policy, especially with regards to farmers markets and local food systems, through legislative and program changes in Congress and the USDA.
• Farmers markets can improve access to healthy food in com- munities that are underserved by retail grocers. Seen in this light, the ability of SNAP recipients to use their benefits at farmers markets is a fundamental public health issue.
RECOMMENDATIONS
The primary recommendations of the report are:
• Support leadership development within the farmers market community by facilitating the development and capacity of state and regional farmers market organizations. This leader- ship development can be done through the Farmers Market Coalition and in tandem with USDA Agriculture Market- ing Service (AMS) and the Farmers Market Promotion Program (FMPP).
REAL FOOD, REAL CHOICE
- Farmers markets should not bear the entire cost of operating EBT terminals. This cost should be subsidized by USDA, pub- lic agencies, and foundations. In California and Iowa, state SNAP agencies cover the variable and fixed costs associated with EBT transactions. Markets are providing a public service, and should be compensated for doing so.
- Launch a nationwide technical assistance program that pro- vides train-the-trainer, mentorship, and teaching opportuni- ties for farmers market practitioner leaders to disseminate best practices in a peer-to-peer format. An organized effort to share lessons learned among farmers markets will help to speed the adoption of practices and technologies in this area. Funding should come from FNS, Farmers Market Promotion Program, USDA AMS discretionary funds, and public health and food systems funders.
- Encouragefarmersmarketstoevolveandexperimentwithnew models that can help address the convenience, product, and cultural issues identified in Chapter III. Locations along public transit lines, additional market days, vouchers for health screenings, more attention to cultural competency, and links to community institutions are potential ways markets can evolve. An innovation fund, supported by regional HEAL Convergences among other philanthropists, could help to seed these efforts.
- IncreasesupportforeducationandoutreacheffortsforSNAP shoppers to patronize farmers markets. Community partners who work with low-income individuals and families have an important educational role to connect SNAP shoppers with healthy food choices at farmers markets and to educate farmers markets and farmers about the barriers SNAP participants face in accessing farmers markets.
- Explore the creation of various programs to entice SNAP shoppers to farmers markets as part of the 2012 Farm Bill. Some options include a bonus benefit to SNAP participants when using their benefits at farmers markets; an extra allot- ment of funds to spend at farmers markets, as with the Farmers
v
Market Nutrition Program; and a dedicated allocation of Spe- cialty Crop block grants to the states for the specific use of promoting SNAP usage at farmers markets.
Secondary recommendations include: Improved data collection on EBT usage at farmers markets, additional resources dedicated to program evaluation, the creation of new indicators of success, more funding for research into alternative technologies, policy changes and additional funding to the Farmers Market Promotion Program, as well as enhanced coordination and partnerships among the pub- lic and private sectors at all levels.
CONCLUSION
Underlying this report are several challenging policy questions, such as:
- How can the billions of dollars the federal government spends on federal food programs, of which SNAP is the largest, ad- dress the increasing rates of chronic diet-related diseases among all persons, but especially among those eligible for these very benefits?
- How can these expenditures be directed away from subsidiz- ing unhealthy foods and toward healthier foods without re- stricting SNAP participants’ choices?
- Howcantheseexpendituresbedirectedawayfromsubsidizing corporate concentration in the food system and toward sup- porting family-scale and locally-based agriculture?On another level, this issue transcends public policy debates, reach- ing into questions about the heart and soul of the community food security movement. What kind of food system do we want, and how can we encourage it through policies, programs, and partnerships? How can we overcome structural barriers to encourage greater ac- cess and consumption of healthy food for all persons regardless of income? Can small farmers make a decent wage selling affordably priced food to low-income consumers without subsidies? How do we ensure equity in the new food system we help to create?
CONNECTING SNAP RECIPIENTS WITH FARMERS MARKETS
vi
REAL FOOD, REAL CHOICE
CHAPTER I. Introduction
Farmers markets are experiencing a recent resurgence, increasingly recognized as important hubs for local food systems in the United States. In the last 15 years, the number of farmers markets in the United States has increased from 1,755 to 5,274. According to USDA, a conservatively estimated 5 million persons per week shop at farmers markets (USDA Farmers Market Manager Survey, 2009). Farmers markets provide a valuable, cost-effective direct marketing opportunity for both established farmers and new producers. They can improve access to fresh fruits and vegetables in communities abandoned by grocery stores and can serve as an important tool to address health disparities in underserved communities. Many com- munities are also experimenting with variations of farmers markets, including farmstands and mobile markets, also known as veggie vans. The positive consumer response to fresh local agricultural products purchased directly from the producer has encouraged a new generation to become involved in agriculture.
As farmers markets become recognized as important community- building institutions for the neighborhoods and towns they serve,
their success encourages the creation of new markets, and the trend continues. However, low-income communities have not fully par- ticipated in this upward trend. Low-resource communities provide unique opportunities for direct marketing, but also substantial eco- nomic, social, and at times cultural barriers to the operation of suc- cessful farmers markets. These barriers are manifested in the overall decline of food stamp (now Supplemental Nutrition Assistance Program or SNAP) redemptions at farmers markets since 1993.
1
(USDA Food and Nutrition Service, 2010)
CONNECTING SNAP RECIPIENTS WITH FARMERS MARKETS
2
This downward trend occurred despite the increase in total SNAP expenditures and in an increase in the number of farmers markets accepting SNAP during the same time frame.
SNAP sales at farmers markets bottomed out at $1,620,344 in 2007, but increased to $4,173,323 by 2009. Although there were only 289 authorized SNAP retailers classified as ‘farmers markets’ according to the USDA Food and Nutrition in 2004, the number grew to 963 in 2009, and is projected to be over 1,100 nationwide in 2010. SNAP redemption at farmers markets (in dollar value) grew by 93.7% between 2008 and 2009 alone. This change is an encouraging testament to the potential for farmers markets to reach and exceed their past level of involvement in federal nutrition pro- grams. Across the board, however, nearly all SNAP authorized re- tailers saw increases in redemptions in this timeframe. This is due in part to the American Recovery and Reinvestment Act, which in- creased benefit levels by $18 – $24 per person, and to the increase in program participation during the recession.
All told, SNAP transactions at farmers markets accounted for a mere 0.008% of total SNAP transactions nationwide in 2009. By way of comparison, USDA estimates that American consum- ers spend roughly 0.2% of their food dollars at farmers markets (USDA Economic Research Service, 2009). Though itself a small percentage, it is 25 times the percentage of SNAP dollars redeemed at farmers markets.
In this context, it is appropriate to identify the challenges that are preventing so many markets from meeting the needs of low-income shoppers. What are the factors allowing some markets, however few, to overcome the challenges of adapting to an EBT system? Where are markets thriving as access points for EBT and what can be learned from their examples? What does success look like at the market, and are these benchmark goals shared by the appropriate state and federal agencies? What will it take to accelerate the inte- gration of SNAP into farmers markets?
A TALE OF TWO MARKETS
In 1999, the Capital Area Food Bank opened the Anacostia Farm- ers Market. The market targeted a low-income area in Washington, D.C. and was one of the first markets that accepted EBT, credit, and debit cards from market shoppers. The Capital Area Food Bank (CAFB) committed high levels of resources to the market, in- cluding developing strategic and business plans, subsidizing many of the farmers at the market, and supporting a professional ad cam- paign. The Food Bank also conducted SNAP outreach at the mar- kets, helping to connect SNAP eligible members of the community to benefits by helping with the application process. The Food Bank ran the market for nine years before deciding to close in 2008. Al- though CAFB had tried incentives programs, ad campaigns, and
other methods of drawing low-income shoppers to the market, they were not seeing the results they needed to justify the amount of resources they were committing to the market (Jody Tick, personal communication, September 9, 2009).
Across the country, in San Diego County, California, another mar- ket opened in June 2008. The City Heights Market developed from a collaboration between the International Rescue Committee, the County’s Farm Bureau, the San Diego County Childhood Obesity Initiative, and the San Diego Nutrition Network. The market is lo- cated in what is considered one of the most diverse neighborhoods in the country, with 30% of the families in the neighborhood living below the Federal Poverty Line. Over the past two market seasons, City Heights, with the help of the Wholesome Wave Double Value Coupon Program, has been able to offer SNAP recipients in the area matching incentives to shop at the market in what they call the Fresh Fund Program. This has led to increased SNAP expenditures at the market, as well as increased awareness and use of the market by low-income members of the City Heights neighborhood. Al- though it is unclear what will happen in the City Heights neighbor- hood if the Market can no longer afford to offer the incentives to SNAP shoppers, City Heights is an example of a market serving a low-income community, and successfully connecting SNAP recipi- ents to a new source of fresh fruits and vegetables (IRC, 2009).
These two markets are only a selection of the SNAP and farmers market programs across the country, but they highlight many of the issues that will be discussed in this report. What factors made the difference between the Anacostia Market and City Heights Market? Will City Heights meet the same fate as the Anacostia Market, or are there other policies, programs, or partnerships at play that are influencing their outcomes? Can we use the experiences of these and other markets to make SNAP EBT programs more effective and sustainable in communities nationwide?
PUBLIC HEALTH ASPECTS OF FARMERS MARKETS
Access to healthy food is becoming widely understood as a social de- terminant of health. Numerous studies have linked food deserts to higher incidences of diet related diseases such as diabetes and obe- sity, with a disproportionate impact on the poor and persons of col- or (Ver Ploeg, Breneman, Farrigan, Hamrick, Hopkins, Kaufman, & Tuckermanty, 2009). Farmers markets can be important access points in underserved communities for healthy food, with greater flexibility and less capital expense than “brick and mortar” retail stores. Farmers markets have their downsides, however, in terms of inconvenient hours, limited selection, and their seasonal nature in most parts of the country. This study does not examine these issues in detail, as health disparities and their links to poor food access have been widely documented in academic and gray literature. For
REAL FOOD, REAL CHOICE
the purposes of this report, it is important to underscore the fact that food access – of which access to farmers markets is a subset – is a public health issue, and an equity issue.
RESEARCH DESIGN
In the interest of making farmers markets a reliable source of healthful foods for SNAP clients, the authors of this report ex- plored a variety of questions. In the following chapters, the chal- lenges and opportunities associated with increasing SNAP sales in farmers markets is approached from a systemic perspective, with primary authorship by two different but complementary organi- zations. The Farmers Market Coalition documented the farmers market perspective regarding SNAP/EBT, while the Community Food Security Coalition focused on the SNAP clients’ and agencies’ perspectives. The policy issues and recommendations are a product of the combined efforts of both organizations.
SNAP RESEARCH STATES
3
Analysis was concentrated on 15 states, selected based on a combi- nation of factors, including:
• TheoverallamountofSNAPredemptionsatauthorizedfarm- ers markets in 2009 (according to USDA FNS)
• ThepercentofallSNAPdollarsstatewideredeemedatfarmers markets in 2009 (according to USDA FNS)
• The total value of SNAP dollars redeemed statewide in 2009 (indicating demonstrated need)
• The rate of growth in SNAP redemptions at authorized farm- ers markets (in dollars) between 2008 and 2009
• The total number of SNAP authorized farmers market retail- ers, statewide, in 2009 (according to USDA FNS)
|
STATE |
NUMBER OF FARMERS MARKETS |
NUMBER OF FARMERS MARKETS AUTHORIZED AS SNAP RETAILERS |
PERCENT OF FARMERS MARKETS AUTHORIZED AS SNAP RETAILERS |
TOTAL 2009 SNAP SALES AT FARMERS MARKET RETAILERS |
|
California |
550 |
51 |
10% |
$929,530 |
|
Illinois |
261* |
9* |
3% |
$11,146 |
|
Iowa |
225* |
167 Farmers** |
N/A |
$62,439 |
|
Louisiana |
31* |
3 |
8% |
Not available*** |
|
Maryland |
100 |
3 |
3% |
$2,126 |
|
Michigan |
217 |
29 |
13% |
$280,611+ |
|
Minnesota |
125 |
7* |
10% |
$3,458 |
|
New Jersey |
132 |
25 Farmers** |
N/A |
$718,121 |
|
New Mexico |
58 |
6 |
10% |
$12,871+ |
|
New York |
450 |
135 |
30% |
$595,126 + |
|
Oregon |
115 |
47 |
41% |
$261,229 |
|
Pennsylvania |
161* |
16* |
10% |
$20,646 |
|
Texas |
105* |
5* |
4% |
$50,163 |
|
Vermont |
80 |
16 |
20% |
$26,157 + |
|
Washington |
140 |
45 |
32% |
$142,789 |
Figure 1 – Data on the number of farmers markets was obtained from FMC statewide farmers market organization via survey (December 2009), unless noted otherwise.
* (USDA Agricultural Marketing Service, 2009)
** EBT pilot programs in Iowa and New Jersey introduced wireless machines at farmers level.
*** USDA is unable to report dollar figures for states with fewer than three farmers market retailers for confidentiality purposes. However, according to one interviewee in Louisiana, three farmers markets did $17,852 (Vanhook, personal communication, March 17, 2010).
+ Discrepancies were identified between the sales reported by FNS and those reported by state farmers market association contacts. According to the New Mexico Farmers Market Association, redemptions in 2009 were $15,500; the Michigan Farmers Market Association $297,000; the Farmers Market Federation of New York $883,000; the Vermont farmers Market Association $36,000.
CONNECTING SNAP RECIPIENTS WITH FARMERS MARKETS
4
The research included literature reviews, surveys, and phone in- terviews. The report reflects a spectrum of state-level stakeholders including SNAP agencies, anti-hunger advocates, departments of agriculture, and statewide farmers markets associations. In addi- tion, some individual farmers markets and supporting non-profit community partners were interviewed, especially where statewide farmers market organizations were less established or nonexistent. For the purpose of this report, 2009 data was used, though in some states the numbers for 2010 are projected to change.
Early in the research process, the research team identified the shared values that they believe are contributing to a growing interest in SNAP at farmers markets. These values include:
- Equity: Consumers should all be treated fairly and that direct- marketing farmers should not face inordinate barriers to par- ticipation in federal programs;
- Choice: Every shopper has a right to assign values to their choices and to choose where they buy their products, and that nontraditional retailers such as farmers markets have a right to choose to incorporate SNAP and other nutrition programs based on the needs of their community, without dispropor- tionate expense;
- Health: All consumers have a right to healthful foods and to opportunities to invest in their community’s health;
- Economic Viability: SNAP programs are administratively and financially feasible for both state agencies and nontraditional retailers like farmers markets; and farmers and farmers market organizations should yield the benefits of increased sales and a diverse customer base.On the ground these values are more challenging to align than they are on paper. Throughout this report, the authors attempt to acknowledge tensions within these value assumptions as they apply either to farmers or to shoppers. In the end, SNAP in farm- ers markets will serve these values, and perhaps others, to varying
degrees depending on the community setting, the farmers market’s resources, and, most importantly, the diverse ecology of commu- nity partners that believe everyone should have access to fresh fruits and vegetables from their local farmers.
At the heart of the Farmers Market SNAP conundrum is a set of deep and meaningful concerns about the connections between fed- eral nutrition and agriculture policy, the alarming health disparities facing the impoverished, and the viability of local agricultural sec- tors. While USDA spends over $50 billion annually on the SNAP program, farmers earn on average 19 cents of every food dollar through the conventional food system. Through direct marketing at farmers markets, farmers earn the full value of every food dollar. Underlying this report are thorny policy questions, such as:
• How can the billions of dollars the federal government spends on federal food programs, of which SNAP is the largest, ad- dress the increasing rates of chronic diet-related diseases among all persons, but especially among those eligible for these very benefits?
• How can these expenditures be directed away from subsidiz- ing unhealthy foods and toward healthier foods without re- stricting SNAP participants’ choice?
• How can these expenditures be directed away from subsidizing corporate concentration in the food system and toward sup- porting family-scale and locally-based agriculture?
On another level, this issue transcends public policy debates to reach into questions about the heart and soul of the community food security movement. What kind of food system do we want, and how can we encourage it through policies, programs, and part- nerships? How can we overcome structural barriers to encourage greater access to and consumption of healthy food for all persons regardless of income? Can small farmers make a decent wage sell- ing affordably priced food to low-income consumers without sub- sidies? How do we ensure equity in the new food system we help to create?
REAL FOOD, REAL CHOICE
CHAPTER II.
Farmers Markets and the SNAP Program
In examining the central question of how to increase SNAP usage at farmers markets, we must first understand farmers markets. Mar- kets differ greatly in size, volume sold, history, capacity, structure, and purpose. They can range from highly organized social enter- prises with clear policies to free-form casual events where farmers gather to offer the local harvest. Such diverse and decentralized en- tities have yet to organize into a strong political force due to their independent spirit and limited capacity to take on additional issues outside of their day-to-day market responsibilities. This chapter provides an overview of farmers market characteristics, including a brief history of food stamp usage at farmers markets before and after the implementation of Electronic Benefits Transfer (EBT).
WHAT IS A FARMERS MARKET?
While nearly everyone has a mental image of a farmers market, there is no consistent legal definition of the term. In fact, many states lack any legal definition of “farmers market,” which some- times interferes with the implementation of market-specific admin- istrative rules. In general, individual USDA programs define the term for their own purposes.
For example, the Agricultural Marketing Service defines a farmers market as: “A public and recurring assembly of farmers or their employ- ees, selling local agricultural products directly to consumers.” (USDA Agricultural Marketing Service, 2009). The Food and Nutrition Service defines a farmers market as: “A multi-stall market at which farmer-producers sell agricultural products directly to the general public at a central or fixed location, particularly fresh fruit and vegetables (but also meat products, dairy products, and/or grains).” (USDA Food and Nutrition Service, 2010). Other organizations, like the Farmers Market Coalition (FMC), might suggest that the purpose of the market is just as important as what physically takes place, and that markets exist “for the purpose of facilitating personal connections that create mutual benefits for local farmers, shoppers, and communities.” (S. Yeago, personal communication, March 26, 2010).
Farmers markets are based on the sale of agricultural products grown, caught, raised, processed, or harvested by the producers themselves (or employees thereof ). In practice, they are not always exclusively limited to these products. Some farmers markets also sell prepared foods, arts and crafts, or even allow, on a limited basis, the resale of products grown outside the region. This latter category is a distinct minority and presents serious challenges to ensuring the
integrity of farmers markets in the public eye.
These definitions provide a description of a farmers market as an event. However, most farmers markets are also organizations, or hosted organizations. When we use the term ‘farmers market orga- nization,’ we mean both organizations that host farmers markets, and markets that act as their own organizational entity (whether incorporated or not). Their legal and organizational structure varies greatly; all farmers market organizations are not alike.
ORGANIZATIONAL STRUCTURE OF FARMERS MARKETS
Farmers markets can range from informal, impromptu events of a small number of producers who self-organize to year-round public markets with permanent structures. On average, farmers markets are either formally or informally organized to manage one or more markets, on a seasonal basis, for a small number of hours, once or twice a week, in an outdoor location – generally a plaza, park- ing lot, or closed street. They may be their own non-profit orga- nization, or they may be sponsored by a non-profit organization, church, or public agency. At times, farmers markets are structured as for-profit businesses under the management of an entrepreneur, but in general, they are not designed as profit-making operations (except for the farmers).
Market experience varies dramatically. There are numerous success- ful markets that were started 20 to 30 years ago, yet very few whose history extends beyond the 1970s. According to USDA’s Farmers Market Manager Survey, nearly 30% of seasonal farmers markets in 2005 were five years or younger (Ragland & Tropp, 2009, p. 9). Since that time, at least one thousand new farmers markets have been developed, indicating that many markets are young organiza- tions still growing.
Farmers markets can also have a transient nature. While many new markets sprout up every year, quite a number fail to thrive and close down after their first season or sooner. Fundamentally an economic enterprise, markets must bring in shoppers to keep their farmers coming back week after week. Farmers will “vote with their feet” and find more lucrative options if their revenue goals are not being met.
It is important to note that most farmers market organizations are not retailers. Instead, they provide management and outreach ser- vices that create a retail sales opportunity for agricultural produc- ers. A farmers market organization provides stalls to vendors for a fee on a daily, seasonal, or percentage basis. This generates funds to operate the market including: securing and maintaining a site, garbage disposal, portable toilets, advertising, and staffing. In ad- dition, the operation of the market may be partially supported by sponsors, donors, and/or volunteer labor.
5
CONNECTING SNAP RECIPIENTS WITH FARMERS MARKETS
6
Generally, the vendor stall fee is either a flat fee or a percentage of vendor sales, with more than 75% using flat fees and fewer than 20% charging a fee based on percentage of sales (Ragland & Tropp, 2009, p. 54). Sometimes it is a combination of both. Generally, the fee is intentionally set as a modest expense for the farmers, which is one reason farmers markets are a cost-effective way for farmers to sell directly to consumers. Equally important to the farmer is the limited number of hours of operation of the market. This provides a high volume sales opportunity that minimizes spoilage and maxi- mizes efficient use of labor.
The staffing capacity of farmers market organizations varies widely. According to USDA, only 39% of farmers markets in the U.S. have a paid employee; and only 22% have more than one employee (Ragland & Tropp, 2009, p. 56). Farmers market organizations are overwhelmingly volunteer-staffed. Not surprisingly, there is consid- erable regional variation in the use of paid staff. For example, only 27% of markets in the Southwest region have an employee.
NUMBER OF PAID EMPLOYEES VS. VOLUNTEERS AT FARMERS MARKETS
(Ragland & Tropp, 2009, p. 57).
Use of paid staff seems to correlate directly with the size of the market, meaning that the more vendors in a market, the more likely the market are to have a paid market manager. Garry Stephenson, a farmers market researcher at Oregon State University, found that markets approaching a size of 30 or more vendors require a paid manager (Stephenson, 2008, p. 99). Generally, these are part-time seasonal positions. The national average annual salary for paid mar- ket managers was $14,323, ranging from a high of $21,913 in the Mid-Atlantic region to a low of $8,864 in the Rocky Mountain (Ragland & Tropp, 2009, p. 58).
In summary, many farmers markets find themselves vulnerable to a host of challenges, including minimal operating funds, reliance on volunteers, regulatory barriers, and inadequate capacity for en- gagement with stakeholders (Ragland & Tropp, 2009; Stephenson, 2008). For these diverse, grassroots entities to truly serve as cen- ters of a new equitable and sustainable American food system, they need leadership tools, technical assistance, organizational support, and learning opportunities to thrive in the long-term.
PURPOSES OF FARMERS MARKETS
In recent years, the number of farmers markets has expanded dra- matically, reaching 5,274 in 2009. This phenomenon is due in part to the rapid growth of consumer interest in and demand for local food. Markets have also become increasingly popular as vehicles for addressing other goals of the host organization. For example:
- Kaiser Permanente hosts farmers markets at many of its clin- ics and hospitals as a means of health promotion for its staff and clients.
- Numerous city governments have established or sought to es- tablish farmers markets as a tool for economic revitalization of a depressed downtown.
- Propertymanagementcompanieshaveorganizedfarmersmar- kets at their malls as an amenity for their patrons and to create a more genuine feel to their faux surroundings.
- Some neighborhood-based organizations have held farmers markets for their ability to create a sense of place and community.These constituencies can bring a variety of missions into the farm- ers market arena. Such social, health, and city planning objectives may not place farmers as primary stakeholders, and therefore orga- nizers do not necessarily plan market operations around the needs and concerns of the vendors. While this new variety of missions enriches the farmers market community, it also complicates the or- ganizing of farmers markets at the state or national level, as not all of them are aware of or interested in the practical or policy issues facing small-scale farmers. Stakeholder diversification can poten- tially lead to conflicts between market organizers and their farmer participants, though it does help embed farmers markets more into the fabric of society and garner broader support for their growth and expansion.ORGANIZING FARMERS MARKETS ON STATE AND FEDERAL LEVELSOrganizing markets at the regional, state, and federal levels is an es- sential tool for both improving the operations of individual markets
REAL FOOD, REAL CHOICE
as well as building their political power. In addition, they have the potential of educating millions of Americans who shop at farmers markets on the value of sustainable food systems and food access. Yet, farmers markets possess a unique set of challenges in organizing at the regional or state level.
First, many farmers markets rely exclusively or almost exclusively on vendor fees as a primary source of income. On one hand, this lack of reliance on outside funding provides more self-reliance and potential financial stability. On the other hand, given the grassroots nature and the small size of many markets, as well as the need to attract producers by keeping fees relatively low, relying exclusively on vendor fees can limit staffing capacity to dedicate time to issues beyond the most necessary market operations.
As the average age of U.S. farmers steadily increases at the same time that the number of farmers markets is doubling, the competi- tion for farmers becomes more intense (USDA National Agricul- tural Statistics Service, 2009). Unlike ten years ago, farmers are less loyal to smaller or start-up markets if other more profitable farmers markets are within a reasonable driving distance. While there can be a sense of camaraderie among managers of local farmers markets as well as among farmers, the reality is that they can be in competi- tion with each other for customers. Given the variety in farmers market goals mentioned previously, they do not automatically share a common mission with each other, as other nonprofits in the same field might (such as anti-hunger organizations).
The broad range in capacity and purpose as well as the diversity of host groups among individual farmers markets can impede organiz-
7
ing across markets. By way of example, the historic differences in purposes of farmers markets in Northern and Southern California (farmer-income oriented versus community-oriented) often acted as an obstacle to collaboratively moving forward a policy goal in the state legislature. The debate surrounding the current pending California legislation to make EBT mandatory in farmers markets is representative of these divergent goals (see Chapter V).
Presently, approximately 30 states have functioning state farmers market associations in varying levels of developmental organization. According to a survey conducted in February 2009 by the Farmers Market Coalition, many of these organizations are relatively young, and 40% of them are not yet federally recognized as nonprofit or- ganizations (Wasserman, 2009). Statewide farmers markets associa- tions can provide support and counsel to all markets, but especially to those markets that struggle with little or no professional staffing. However, fewer than half of all state farmers market associations provided some kind of training on EBT certification and terminal usage, with slightly over 25% actually securing funding to offer ac- cess to EBT/credit card terminals (2009).
This research also explored the additional role played by some state associations (New York, New Mexico, Washington, and Oregon in particular) as advocates and points of connection between policy- makers, various state agencies, and allied organizations. Nation- wide, however, only about 50% of existing state farmers market associations claim to engage in any state or local-level advocacy activities. Other state associations are beset by many of the same challenges as the farmers markets they represent: limited or no staff- ing capacity, dependence on volunteer leadership, and a subsequent
STATEWIDE FARMERS MARKET ASSOCIATION STAFFING CAPACITY
|
STATE |
STATEWIDE FARMERS MARKET ASSOCIATIONS |
TYPE OF STAFF |
|
CALIFORNIA |
Multiple Regional Farmers Market Association (Examples – California Fed- eration of Certified Farmers Markets, Pacific Coast Farmers Market Assn., Southland Farmers Market Assn.) |
Full-time paid staff in each organization |
|
ILLINOIS |
Informal statewide coalition |
No paid staff |
|
IOWA |
Iowa Farmers Market Association |
Volunteer leadership |
|
MARYLAND |
No statewide farmers markets association; Maryland Department of Agricul- ture (MDA) provides training and promotion for farmers markets |
Full-time Agriculture Marketing Specialist at MDA |
|
MICHIGAN |
Michigan Farmers Market Assn. (MIFMA) |
Part-time paid staff |
|
MINNESOTA |
Minnesota Farmers Market Assn. (MNFMA) |
Volunteer leadership |
|
NEW MEXICO |
New Mexico Farmers Market Assn. (NMFMA) |
Paid staff |
|
NEW YORK |
Federation of New York Farmers Market Assn. (FMFNY) |
Paid staff |
|
OREGON |
Oregon Farmers’ Markets Assn. (OFMA) |
Volunteer leadership |
|
VERMONT |
Vermont Farmers Market Assn. (VFMA) (under umbrella of Northeast Or- ganic Farmers Association) |
Paid staff (NOFA-VT) |
|
WASHINGTON |
Washington Farmers Market Association |
Part-time staff |
Source: (FMC Farmers Market SNAP Survey, 2010)
CONNECTING SNAP RECIPIENTS WITH FARMERS MARKETS
8
inability to lay the groundwork for partnerships with state agencies that might support their work to provide SNAP/EBT services to farmers markets on the ground. In those states with no formalized association or network, there are veritable advocacy vacuums.
The chart on page 7 indicates some of the variations among leader- ship capacity within statewide associations across the country. Even when paid staff exists, it is often limited to one or fewer full-time equivalents.
Statewide farmers market associations are most effective when they are included in larger statewide coalitions such as the Vermont Campaign to End Child Hunger or the Michigan Farmers Market Food Assistance Partnership. Member organizations of these state- wide coalitions include state agencies, state food policy councils, USDA FNS and agriculture agencies, non-profits, farmers mar- kets, Cooperative Extension, SNAP ED contractors, and farmland trusts. These coalitions have successfully pursued federal and state grants, created statewide promotional campaigns, and advocated for public policy and state funding.
Where statewide farmers markets associations do not exist, other strong farmers market organizations may fill the gap. For example, marketumbrella.org in New Orleans is nationally known for their innovative farmers market programs, especially in low-income com- munities. Their publications, as well as those of other groups such as Project for Public Spaces, support the education and professional development of farmers market managers. Workshops at numer- ous small farm and organic farming conferences are also essential mechanisms for supporting market managers and organizers.
In other cases, state departments of agriculture may serve as the ed- ucator and convener of farmers markets. For instance, Maryland’s farmers markets located outside of urban areas have historically been weekly events organized by participating farmers. Amy Crone, Agricultural Marketing Specialist in Maryland, sees the lack of a statewide farmers market association as limiting the opportunity to create a learning community among direct marketing farmers and market managers and organizers (personal communication, Febru- ary 2, 2010).
KEY PLAYERS IN EBT AT FARMERS MARKETS AND THEIR ROLES
Many different organizations and individuals play a key role in the successful operation of farmers markets and in the implementation of electronic benefits transfer at these markets. It’s helpful to better understand the role of these entities. Here’s a brief description of each entity’s role vis-à-vis EBT:
• Farmers/Producers: From the perspective of many farmers markets, the farmer is the “primary” customer because with-
out his/her participation, there is no market. Farmers see farm- ers markets as a short, concentrated shopping venue where they can capture the retail value of their product. Farmers can be authorized SNAP retailers if they produce and sell SNAP eligible products.
• Market Manager: The person responsible for the successful op- eration of the market. S/he collects fees from farmers, adver- tises the market, coordinates with local jurisdictions on permits and licenses, recruits and manages volunteers, and establish- es and operates any EBT program on site. Their leadership is the building block of any successful EBT program.
• Market Organizations: The organization that is responsible for the operation of the market, and which employs the market manager. In some cases, the market itself may be incorporated. In other cases, the market is sponsored by a host group, such as a church, community-based NGO, public agency, or by an entrepreneurial operation. This entity may decide whether to incorporate EBT at the market, and can play a key role in outreach to community members and other groups that repre- sent them.
• Merchant Service Providers: These third party providers (TPP) sell and service wireless technology for electronic benefits (EBT), debit, and credit card machines. TPP organizations manage and/or contract with a group of partners that provide very specific services to complete wireless transactions includ- ing bank-to-bank money transfers.
• Anti-Hunger Organizations: Advocacy and relief-oriented groups, such as food banks, are in frequent contact with SNAP recipients and advocate on their behalf at all levels of govern- ment. These entities are important partners in ground proofing EBT systems, helping with outreach to potential SNAP re- cipients, and in discussions with state SNAP administrators (with whom they work frequently).
• Food System Groups/Community Groups: These organiza- tions tend to be relatively small, but often have significant experience developing partnerships with a wide range of orga- nizations across the food system. They can leverage fundrais- ing expertise, technical assistance, and coalition building to achieve their goals. Community groups, such as churches and neighborhood associations, can provide a crucial link to SNAP recipients, educating them about the benefits of shop- ping at farmers markets.
• Public Health Groups: Like public health agencies, their mis- sion is to reduce the incidence of chronic disease and promote wellbeing. They can be partners in advocating for EBT at mar-
REAL FOOD, REAL CHOICE
kets, bring in resources for incentive programs, cover the costs of terminals, or help educate and evaluate from a science- based perspective. Some public health groups are beginning to look further upstream to find the factors of the built environ ment that inhibit or enhance opportunities for healthy eating. Also, the Centers for Disease Control are now publishing state fruit and vegetable indicator reports that link consumption patterns with the built environment.
- Farm Groups: These local and regional associations provide technical assistance and opportunities for peer-to-peer learn- ing for their farmer members on a wide variety of direct mar- keting issues, including taking SNAP benefits.
- State Departments of Agriculture: These agencies provide li- censing and regulatory functions as well as promotional ma terials and campaigns for farmers markets. They also partner with other state agencies on matters related to farmers markets, such as on the Farmers Market Nutrition Program. Farmers and farmers markets are generally considered an important constituent.
- Cooperative Extension: Extension operates a variety of pro- grams around nutrition education, technical assistance for small farmers, and other services. With connections in the state land grant university system, state government, and USDA, Extension is well placed to bring a variety of resources to farmers markets wanting to serve SNAP clients.
- StateSNAPAdministrators:Eachstatechoosestheappropriate agency to administer the SNAP program. Typically it is through a human or social service department, or on occasion a health agency. This agency distributes funds to SNAP re- cipients; has the authority to negotiate contracts with EBT da- tabase contractors; and implements federal regulations related to the SNAP program. As seen in subsequent chapters, its staff can play a key role in passively or actively supporting the use of SNAP at farmers markets.
- State or Local Public Health Department: In their efforts to reduce health disparities and the incidence of diet-related dis- eases, these agencies may partner with other agencies and community partners to promote farmers markets in low-in- come communities, using incentives, conducting outreach, or facilitating EBT usage. They may also administer the Senior Farmers Market Nutrition Program, whose beneficiaries may also receive SNAP.
- StateorRegionalFarmersMarketAssociations:Thesealliances represent the collective interests of farmers markets in a de- fined area, and may provide opportunities for capacity build-
ing, technical assistance, and policy advocacy.
• Farmers Market Coalition (FMC): FMC is a national organi- zation that represents farmers markets at the state and federal level, communicating their needs and garnering public and private support for their long-term growth and sustainability. FMC provides networking and technical assistance to state and regional farmers market organizations as well as to indi- vidual farmers markets.
• USDA: The Department of Agriculture has various agencies that interface with farmers markets and the SNAP program. Food and Nutrition Service manages the SNAP, WIC, and FMNP programs. As seen in Chapter VI, the policies of FNS can facilitate or hinder EBT at farmers markets. The Agricul- ture Marketing Service promotes farmers markets, oversees updates to an annual directory, and manages the Farmers Market Promotion Program. Other grant programs within USDA that have been used to support farmers markets in- clude: Sustainable Agriculture Research and Education, Feder- al State Marketing Improvement Program, Community Food Projects, and Specialty Crop Block Grants. USDA Deputy Secretary Kathleen Merrigan’s Know Your Farmer, Know Your Food Initiative is focused on supporting local food systems, with an emphasis on linking nutrition and agriculture programs.
HISTORY OF FOOD STAMPS/SNAP IN FARMERS MARKETS
In the 1980s, ‘EBT’ was not a common acronym for any retailer. Nev- ertheless, food stamp coupons were commonplace in farmers markets. Jeff Cole from Silvermine Farm in Sutton, Massachusetts recalls re- deeming approximately $12,000 in food stamp vouchers at the Worces- ter Farmers Market in one year in the mid 1980s. Now, as Executive Director of the Federation of Massachusetts Farmers Markets, Cole says “I don’t know of any farmers market in the state doing more than $2,000 in EBT annually. And don’t forget that in the ‘80s, we were selling tomatoes for less than a dollar a pound!” (Jeff Cole, personal communication, March 2010).
Until 1996, food stamps were paper coupons that could be ex- changed for purchases of non-prepared food. Treated like cash, these coupons could be used by the shopper to pay the farmer di- rectly for his product with their food stamp coupons. Market ven- dors would submit the coupons they had accepted to the market organization for cash redemption or to pay their stall fees. In 1993, $9.3 million in paper food stamps were redeemed at 643 farmers markets. This accounted for 0.044% of all food stamp transactions that year.
The 1996 Farm Bill required states to replace the paper coupon sys-
CONNECTING SNAP RECIPIENTS WITH FARMERS MARKETS
9
10
tem with an Electronic Benefit Transfer (EBT) debit card system. The overarching purposes behind this change were to reduce fraud and abuse inherent with paper coupons and to destigmatize the use of food stamps at the checkout counter. Food stamp users would no longer be identifiable or judged by other shoppers in line behind them, but instead would pay for their groceries by swiping a plastic card, just like middle-class debit or credit card holders. USDA be- gan a multi-year process to transition states to this new technology. The conversion was done on a state-by-state basis over a number of years and was completed in 2004.
FARMERS MARKET SNAP STATISTICS, 1994-2009
Like debit or credit card sales, EBT is predicated upon the use of a point of sale terminal run by electricity, and a phone line to check the availability of funds in the holder’s account. This technology was designed to serve the needs of the vast majority of food stamp redemption outlets: supermarkets, grocery stores, and other indoor establishments with access to electricity and a land (phone) line. Non-traditional vendors, such as farmers markets, with a miniscule share of the food stamp market, were overlooked.
|
FISCAL YEAR (OCT. 1-SEPT. 30) |
TOTAL NUMBER OF FARMERS MARKETS (USDA AMS) |
AUTHORIZED FARMERS MARKET SNAP RETAILERS (USDA FNS) |
TOTAL VALUE OF SNAP/FOOD STAMPS REDEEMED AT FARMERS MARKETS |
TOTAL VALUE OF SNAP/FOOD STAMPS REDEEMED AT FARMERS MARKETS IN 1994 DOLLARS |
PERCENT OF FARMERS MARKETS REDEEMING FOOD STAMPS/SNAP |
|
1994 |
1755 |
482 |
$6,511,054 |
$6,511,054 |
27.5% |
|
1996 |
2410 |
643 |
$5,844,342 |
$5,520,000 |
26.7% |
|
1998 |
2746 |
490 |
$3,806,801 |
$3,406,000 |
17.8% |
|
2000 |
2863 |
253 |
$2,624,843 |
$2,260,000 |
8.8% |
|
2002 |
3137 |
274 |
$2,812,813 |
$2,320,000 |
8.7% |
|
2004 |
3706 |
289 |
$2,709,828 |
$2,130,000 |
7.8% |
|
2006 |
4385 |
444 |
$3,834,875 |
$2,820,000 |
10.1% |
|
2008 |
4685 |
753 |
$2,740,236 |
$1,890,000 |
16.1% |
|
2009 |
5274 |
936 |
$4,173,323 |
$2,880,000 |
17.7% |
(USDA FNS, February 2010)
Food stamp/ EBT transactions soon became problematic for farm- ers markets. Most farmers market sites are outside, in a parking lot or on a closed street, for example, and lacked a telephone line and electricity to accommodate the hardwired EBT machines then available. Cell phone service was spotty and often prohibitively ex- pensive. A call to authorize a food stamp manual voucher1 transac- tion of one or two dollars might have cost 30 to 50 cents. As EBT rolled out across the nation, states began to experience a precipitous decline in food stamp/SNAP redemption in farmers markets.
In essence, most farmers markets found themselves on the wrong side of the digital divide. The financial, human resource, and in- formation costs associated with implementing, promoting, and op- erating successful EBT programs were beyond the reach of many
1 Manual Vouchers – A two part form on which a SNAP shopper’s information
is handwritten, and mailed to local SNAP administration office for the market’s reimbursement.
REAL FOOD, REAL CHOICE
smaller community markets, especially those in neighborhoods most in need of fresh produce options.
By the conversion deadline in 2004, only 289 farmers markets ac- cepted food stamps (now re-named Supplemental Nutrition As- sistance Program or SNAP) for a total value of $2.7 million, only 0.011% of total SNAP benefits. This downward spiral occurred while total SNAP usage increased to $24.5 billion nationally, $3 billion above the 1996 level of food stamp use.
With the introduction of fast and affordable wireless EBT machines (and cell phone calls), the number of farmers markets accepting SNAP is starting to rebound. In 2009, nearly 18% of all farmers markets accepted SNAP. Yet, although the number of participat- ing markets in 2009 (936 markets) greatly exceeds the number of participating markets during the paper coupon era, SNAP sales at farmers markets are significantly less in 2009 than in 1993 both
(USDA FNS, February 2010).
in total dollars and as a percentage of SNAP benefits. This holds true despite record high levels of SNAP use in 2009 (USDA FNS, February 2010). SNAP participants spent fewer food dollars in farmers markets in 2009 than they did in 1993, despite the increase in the total SNAP budget and the increase in the number of farmers markets accepting SNAP. The reasons why SNAP recipients have “voted with their feet” to shop elsewhere is discussed in Chapter III of this report.
There is vast potential to improve access to healthy options for low- income families while simultaneously bolstering the viability of small family farms. Even if SNAP redemptions at farmers markets grew to account for only 1% of all SNAP transactions annually, that would equate to an additional $494,668,112 going directly to local farmers, ranchers, fisherman, and food entrepreneurs. In the two chapters that follow, we examine the challenges to more fully implementing the use of SNAP/EBT programs at farmers markets nationwide.
CONNECTING SNAP RECIPIENTS WITH FARMERS MARKETS
11
12
CHAPTER III. The SNAP Recipient Perspective
THE SNAP PROGRAM AND SNAP RECIPIENTS: BACKGROUND
On October 1, 2008, the name of the Food Stamp Program was changed to “Supplemental Nutrition Assistance Program” (SNAP). As stated by the ERS Food Assistance Landscape Annual Report, the “new name reflects the program’s mission to not only provide food assistance, but also increase nutrition to improve the health and well-being of low-income people” (2008). The renewed focus by the USDA Food and Nutrition Service (FNS) on the health and well-being of low-income citizens raises an opportunity to exam- ine broader issues associated with food access and community food systems. This focus, as well as the progress of EBT technology, highlights the opportunity available in farmers markets as sources of fresh fruits and vegetables for SNAP recipients.
The 2005 Dietary Guidelines for Americans underscored the value of increasing fruit and vegetable consumption in addressing nutri- tional health and susceptibility to disease (USDA and Department of Health and Human Services, 2005). As a joint author of the Guidelines, USDA turned to fruit and vegetable consumption as one of the pathways for improving the health of individuals par- ticipating in federal nutrition assistance programs. This perspective has taken root in various programs embedded in USDA Food and Nutrition Service: the Fresh Fruit and Vegetable Snack Program at schools; the Healthy Incentives Pilot Program linked to SNAP; and the introduction of fruits and vegetables into the WIC package. Similarly, USDA has turned towards creating linkages between the recipients of federal food assistance programs and farmers markets as a source of healthy foods. The clearest examples of these efforts by USDA can be seen in the WIC Farmers Market Nutrition Pro- gram (FMNP) and the Senior Farmers Market Nutrition Program (SFMNP), in which WIC and elderly recipients receive vouchers during the farmers market season that can only be used to pur- chase foods at farmers markets. The Farmers Market Promotion Program, which includes a set-aside of 10% of its funding for EBT- related grants, and the Obama Administration’s proposal to fund $4 million for EBT equipment at farmers markets, are two of the more recent initiatives to make this connection. These programs will be discussed in more detail in Chapter VI.
Public dialogue about farmers markets and SNAP programs is often limited to the technical, financial, and administrative aspects facing market managers in accepting SNAP at individual markets. This dialogue overlooks perhaps the biggest challenge of all: Gaining the on-going patronage of farmers markets by SNAP participants.
Farmers markets are not the first choice for food shopping for most Americans. SNAP participants are no different in taking into ac- count a complex set of variables in choosing where to do their food shopping and whether to redeem their benefits at farmers markets.
In order to better understand how to implement SNAP/EBT at farmers markets, this chapter provides an overview of the charac- teristics of the individuals receiving SNAP, current issues relating to SNAP recipients, and how the demographics of SNAP recipients may impact food and shopping choices. The chapter continues with an examination of the barriers to patronizing farmers markets by SNAP recipients and strategies used to increase SNAP partici- pants’ awareness of farmers markets. It also includes a brief descrip- tion of the major players involved in the SNAP program, and a look at the SNAP-Education and Outreach programs as potential avenues for educating SNAP users about markets.
WHO ARE SNAP RECIPIENTS?
SNAP recipients represent a cross-section of Americans living near or below the poverty line. States determine eligibility of SNAP participants using federal guidelines that calculate total monthly income and resources: Monthly income must be at or below 130% of the poverty guidelines ($2,238 for a family of four in 2008), and the additional resources considered include cash and some non-liq- uid resources, such as some vehicles (worth more than $4,650). Ac- cording to the FNS report “Characteristics of Supplemental Nutri- tion Assistance Program Households: Fiscal Year 2008,” the Federal SNAP Program distributed benefits to 27.8 million people living in 12.5 million households in 2008 fiscal year (USDA FNS, 2009). The following present general demographic data:
- 87 % of those individuals were below federal poverty guide- lines, although individuals living up to 130% of the federal poverty guidelines are eligible to receive benefits.
- 49% percent of SNAP participants were children. The pro- gram served 6.3 million households with children per month.
- 19% of individuals in the program were elderly (over 65) and 23% were individuals with disabilities. (USDA FNS, 2009).Additionally, in terms of race and ethnicity:
• In 2008, 30% of participants were white, 23% were African- American, non-Hispanic, 15% were Hispanic, 3% were Asian, 4% were Native American, and 26% were of unknown race or ethnicity (USDA Food and Nutrition Service, 2009 October).
In the past several years, there has been a large increase of SNAP participants (and individuals eligible for SNAP benefits) as the re-
REAL FOOD, REAL CHOICE
sult of unemployment and downsizing. In fact, according to the FNS data on SNAP participation, the number of recipients has increased from approximately 28.5 million in 2007 to nearly 34 million individuals as of December 2009 (USDA FNS, 2010 De- cember). The economic downturn is largely responsible for the rapid increase in SNAP participation levels.
Another important factor to consider is the number of individuals eligible for SNAP but not receiving benefits. The SNAP-eligible population has risen by more than 10% since 2001. According to the report “Trends in Supplemental Nutrition Assistance Program Participation Rates: 2000-2007,” in 2007, only two-thirds of the 39 million persons eligible for SNAP actually received benefits (USDA Food and Nutrition Service, June 2009). Further exploring this, in the Food and Action Resource Center’s (FRAC) recent report on Food Stamp Access in America: A City-by-City Snapshot, FRAC noted that “[i]n total, more than $2.27 billion in federally-funded benefits were left unclaimed by the 23 cities and urban counties (highlighted in the report) in 2005. This issue has led to increased emphasis and funding for SNAP outreach, which may be a factor in informing new SNAP recipients of opportunities available at farm- ers markets” (FRAC, 2009).
Additionally, demographics may also play a role in the trends. As noted on the FNS website, there were two categories of individuals highlighted as currently underrepresented in the SNAP program: Seniors and Hispanics.
- “In 2006, approximately 2 million seniors (60 years of age or older) received food stamp benefits, representing 9% of to- tal participants. The participation rate for seniors in the SNAP in 2005 was 30%. Only one-third of eligible seniors partici- pate in the SNAP.”
- “In 2004, one of seven people in the United States was of His- panic origin. Research indicates that Latino families are more likely to live in poverty than white, non-Hispanic households. In 2005, the participation rate for Hispanics in the SNAPAccording to FNS’s Office of Research and Analysis, seniors may not participate in SNAP because of the perceived low monthly ben- efit or because of fears of giving personal information to people they do not know. Hispanic persons may not participate because of language barriers, concerns about their immigration status, or their work schedule (USDA FNS, November 2009). The issue of demo- graphics and SNAP participation is also discussed in another study of SNAP participation rates. The report highlights possible factors that account for differing participation rates in different states with different demographics, noting that particular populations, such as the elderly, may face more barriers in applying for SNAP benefits (Cody et. al, 2008, p.87).
SHOPPING WITH SNAP BENEFITS: WHERE AND HOW SNAP RECIPIENTS CHOOSE TO SHOP
The concept of consumer choice forms a cornerstone of the SNAP program: recipients can use their benefits for any non-prepared food item (with some exceptions for qualifying populations). The government does not restrict, and with the exception of the new Healthy Incentives Program, nor incentivize the food purchases SNAP users can make (USDA FNS, January 2010).
According to a July 2008 Government Accountability Office study on the Food Stamp Program during the 2007 fiscal year, entities authorized to accept SNAP benefits were distributed as follows: Supermarkets 13%, superstores 8%, grocery stores 18%, and convenience stores 35%. Other categories included combination stores (15%) such as independent drug stores, dollar stores, and general stores and, relevant to this report, “all other stores,” which includes farmers markets, wholesalers, non-profit food-buying co- ops, military commissaries, and delivery routes (9%). The majority of SNAP purchases/transactions are currently done at supermar- kets, with 50% of SNAP dollars redeemed, followed by superstores at 35%, grocery stores at 6%, and convenience stores at 4%. The “all other stores” reflected 2% percentage of total SNAP dollars re- deemed. (GAO, July 2008).
Source: (Ver Ploeg, Breneman, Farrigan, Hamrick, Hopkins, Kaufman, & Tucker- manty, 2009).
CHALLENGES FOR SNAP RECIPIENTS CHOOS- ING TO SHOP AT FARMERS MARKETS
Farmers markets are a minor grocery shopping venue for SNAP recipients, just as they are for the consumer population at large. However, a cursory glance at statistics seems to indicate that non- SNAP users spend a greater percentage of their grocery budget at farmers markets as compared to SNAP beneficiaries. According to calculations based on data from the USDA’s Economic Research Service and Agricultural Marketing Service, consumers overall spent 0.2% of their food dollars at farmers markets in 2009 (USDA
13
CONNECTING SNAP RECIPIENTS WITH FARMERS MARKETS
14
Economic Research Service, 2009; USDA Agricultural Marketing Service, 2009). Why is this the case?
There have been a limited number of studies examining how SNAP recipients make food shopping decisions. For example, in a study titled “Barriers to Using Urban Farmers Markets: An Investigation of Food Stamp Clients Perceptions,” researchers interviewed 108 SNAP recipients in an examination of the challenges markets face in attracting SNAP recipients to their markets. The study con- cludes that “[f ]armers market organizers face both negative percep- tions and operational realities: higher prices, inconvenient hours, complex shopping experiences, and limited discount opportuni- ties” (Oregon Food Bank, October 2005). Similarly, other studies, such as the report completed by D.C. Hunger Solutions, called “Food Stamps Accepted Here: Attracting Low-Income Consumers to Farmers Markets,” make recommendations to markets regarding how to better serve low-income shoppers including: Developing thenecessaryinfrastructureforacceptingSNAP,WIC,andFMNP, building partnerships designed to involve the community, conduct- ing targeted outreach, and offering a product mix that is respon- sive to diverse customer’s needs. In “Hot Peppers and Parking Lot Peaches” (1999), Andy Fisher notes a few additional criteria for successful markets in low-income communities:
- Farmers markets should not be imposed from the outside on a low-income community. Market organizers should use a com- munity organizing approach rather than a publicity-based strategy.
- Hiring community members who speak the language of the shoppers can help to make customers feel comfortable at the market.
- Markets need to be subsidized as a community service rather than as a profit-making venture.
- The importance of political connections and the ability to navigate City Hall can not be underestimated.
- Farmers should be included in the management of the market through advisory boards or other similar mechanisms.These studies provide a valuable starting point for looking more closely at why SNAP recipients choose or do not choose to shop at farmers markets and what factors need to be considered to best serve SNAP recipients at the farmers market.In order to develop a clearer understanding of the barriers SNAP recipients face in terms of their shopping decisions, we conducted interviews with 20 different leaders regarding their perceptions of the challenges facing SNAP recipients when considering using their
benefits at a farmers market. We also conducted surveys of seven state agencies regarding their perceptions of barriers to participa- tion by SNAP recipients in their states. The following section pro- vides an overview of the information received from the 27 differ- ent individuals, organizations, and state agencies. These survey and interview subjects have worked with SNAP recipients and farmers markets in varying capacities, ranging from government positions as the SNAP administering body or EBT director, as well as from advocacy and policy organizations, food banks, social service agen- cies, and one faith-based organization. It should be noted that there is little information available in terms of direct surveys conducted with SNAP recipients (with exceptions seen in Washington and Iowa) and that barriers listed below are based on the perceptions of individuals working in the field. Such interviews, while highly desirable, were beyond the scope of this report.
PRICE AND PERCEPTION
The majority of individuals providing information on their com- munity highlighted issues of affordability as the main factor deter- ring SNAP recipients from visiting farmers markets. Examples of this issue can be seen both in the survey data resulting from the Washington Farmers Market Technology Pilot Project (Jon Camp, personal communication, January 26, 2010), in a recent Washing- ton Post article on incentive programs, as well as an article in The Oregonian (Black, 2009; Cole, 2009). Although there has been limited research on cost comparisons between supermarkets and farmers markets, the majority of individuals contacted noted that SNAP recipients perceive farmers markets as more expensive. Even though some studies may highlight that price differences are actual- ly varied or even lower at farmers markets for many products (Proj- ect for Public Spaces, 2008; Pirog and McCann, 2009), it is clear that price and perceptions of price impact SNAP recipients’ shop- ping decisions. This issue is exacerbated by the low benefit levels of the SNAP program, as calculated by the outdated and rigid Thrifty Food Plan (C-SNAP and Philadelphia Grow Project, 2008).
Even in those places where efforts have been made to clarify the cost differences, such as the former Anacostia Farmers Market, the perception of the SNAP recipients affected the success of the market (Jody Tick, personal communication, September 9, 2009). Those organizations and agencies highlighting this barrier discussed existing or potential incentive and matching programs as ways to address the affordability issue for SNAP recipients. Yet a few orga- nizations contacted noted that the incentive programs help to in- crease redemption rates because they supplement SNAP recipients’ benefits, but it is unclear if they can maintain increased redemption rates after the market is no longer receiving outside financial sup- port. Other organizations or markets have begun to research price differences between markets and grocery stores serving low-income communities as a way to demonstrate the actual price differences between markets and grocery stores. Price comparisons are also cur-
REAL FOOD, REAL CHOICE
rently being undertaken in Seattle and New Orleans, revealing that for many products, prices at farmers markets are actually lower, pound for pound (Jones, 2009; marketumbrella.org, 2008). Some research suggests that price is actually less of a barrier to healthy choices and shopping at farmers markets in particular, than con- venience and knowledge of when and where farmers markets are available (Aubrey, 2010; Davies & Neckerman, 2009).
ACCESS, HOURS, AND CONVENIENCE
In addition to the affordability and transportation issues most often mentioned by those contacted, several individuals mentioned issues of convenience affecting SNAP recipients’ decision to shop at mar- kets. For those individuals working multiple jobs, farmers markets do not offer the convenience of supermarkets open 24/7. Also, the food stamp cycle, with benefits becoming available at the beginning of the month, can be a deterrent to shopping at farmers markets later in the month, as many recipients purchase most of their food at the beginning of the month when they receive their benefits on their EBT card (Jody Tick, personal communication, September 9, 2009; Wilde & Ranney, 2000).
With most markets operating on a seasonal basis, even loyal shop- pers are perennially re-habituated back into traditional retail food outlets like grocery stores in the off-season. As a result, shoppers habits would need to change yet again at the start of the market season to accommodate market’ reopenings.
CULTURAL ISSUES
As noted in the D.C. Hunger Solutions report on attracting low-in- come consumers to the market (2007), as well as from communica- tion with the Capital Area Food Bank and End Hunger Connecti- cut, the perception of the community directly impacts the success of EBT in a farmers market (Jody Tick, personal communication, September 9, 2009; Lucy Nolan, personal communication, Sep- tember 9, 2009). One of the recommendations made in the D.C. Hunger Solutions report is to: “Foster a market environment that is welcoming to diverse cultures.” The report applies specifically to D.C.’s “H” Street Farmers market, but based on the comments received from various organizations and agencies, it is valuable to consider how to create a welcoming environment for various groups in the community. The report discusses solutions such as contact- ing organizations whose membership reflects the various groups in the community, employing or hosting neighborhood residents, and creating incentives to draw in consumers (D.C. Hunger Solutions, 2007).
In addition, the cultural appropriateness of available foods is an important factor for immigrants and minority ethnic groups. The knowledge or perception of not being able to find culturally ap- propriate Latin, Middle Eastern, African, Eastern European, and
15
other ethnic foods at farmers markets can be a strong disincentive for such groups to shop there.
TRANSPORTATION
An additional barrier highlighted by those individuals contacted was transportation. This not only includes the distance from a home to the market, but also concerns regarding transporting chil- dren/families to the market or finding childcare for children in or- der to complete shopping needs. Some organizations and markets, such as Hunger Action LA and the Lents Market in Portland, OR, have attempted to address transportation concerns by providing van or bus services from lower income neighborhoods to the mar- ket, but those organizations do not have the resources to provide transportation over the long-term (Amy Gilroy, personal commu- nication, July 31, 2009; Frank Tamborello, personal communica- tion, August 10, 2009). Issues surrounding transportation are also impacted by how SNAP recipients choose where to purchase food and how farmers markets could potentially better serve the product and location needs of SNAP recipients.
The transportation concerns related to SNAP recipients and farm- ers markets also connect to the broader issue of food deserts in the anti-hunger field. In the recent ERS Food Desert Report (2009), the researchers point out that distance is most often used as the measurement of access in food desert and other food access research. Some studies have also included choice or density of choices, but these studies are primarily examining “potential access” versus “real access.” The discussion surrounding food deserts and transporta- tion issues for low-income communities, and possible solutions, may be important to consider when looking at developing new markets in low-income areas.
PRODUCT ISSUES
The final barrier noted by organizations and agencies interviewed for this report is the product choice available at farmers markets. This connects somewhat to the convenience factor but is a spe- cific issue associated with farmers markets. As individuals have be- come accustomed to “one-stop-shopping,” using farmers markets requires additional shopping trips to purchase products not usually available at markets. This increases the amount of time a SNAP recipient must spend in acquiring the food and other goods he or she needs for the upcoming days or week. For example, individuals may choose to shop at a grocery store because they carry the same items year round (such as bananas), as well as toilet paper, clean- ing products, and other non-food items, whereas a farmers market does not offer this consistency. As family food consumption is of- ten routine and habitual, the availability (or unavailability) of these products could impact shopping choices.
CONNECTING SNAP RECIPIENTS WITH FARMERS MARKETS
16
LACK OF AWARENESS
Farmers markets do not typically have large advertising budgets. As such, many individuals in a community may not be aware of their existence or the hours that they operate. The issue of awareness was noted as a barrier by the state of Washington. Furthermore, Maryland and New York, noted that a lack of funds for staffing outreach at markets also diminished their ability to connect SNAP recipients with farmers markets. This particular topic will be ad- dressed in depth in a forthcoming section.
EFFECTIVE STRATEGIES FOR DRAWING SNAP RECIPIENTS TO FARMERS MARKETS
Outreach, anti-hunger, and faith-based organizations, as well as food banks and food pantries, are invaluable resources to consider in the context of SNAP recipients and farmers markets. The indi- viduals working for these organizations are in direct contact with SNAP populations and as a result have the capacity to provide ser- vices tailored to specific populations and communities. Although state agencies can play an important role in distributing funds for outreach and education, communicating policy, and developing partnerships between other agencies, these organizations are key to increasing SNAP recipients’ use of farmers markets as a shopping destination. Listed below are several strategies used by organiza- tions to inform SNAP recipients of the farmers markets. These strategies are not only relevant to organizations, but also emphasize how interconnected the success of the strategies can be between the players in the SNAP landscape.
Flyers, Brochures, and Signage
The majority of individuals providing information about their communities used or had used some form of marketing in relation to their EBT programs. Most of the evidence of the effectiveness of these advertising campaigns was either anecdotal or was reflected in increased redemption rates for that market season.
Examples of programs focused heavily on this type of strategy can be found in Iowa, where the State Human Services agency devel- oped professional signage and radio campaigns in support of EBT at farmers markets, and Berkeley California, which developed large signs to display at the market, press releases, and articles in the newspaper. In Berkeley, they also offered $1.00 coupon flyers that were handed out to WIC Farmers market Nutrition Program re- cipients (Jan Walters, personal communication, August 26, 2009; Penny Leff, personal communication, August 6, 2009). Each of these programs attempted to distribute the flyers and informa- tion through a variety of different locations, including the mar- kets themselves, as well as through social service agencies and food banks, and if possible, to the individual SNAP recipients. Other examples include efforts in D.C. by D.C. Hunger Solutions and the Capital Area Food Bank, which each developed signage to be used
in Metro bus stations around the city. These flyers, brochures, and signs most often included information regarding which markets or vendors accepted EBT and the locations and hours of operation for those specific markets. Depending on the particular community, some organizations or agencies provided flyers or posted signs in multiple languages.
Other examples of flyers and brochures, include providing infor- mation on local markets with food boxes (Oregon Food Bank) and sending flyers out with power bills (Agriculture and Land-Based Training Association in Monterey County), or conducting cook- ing demonstrations and handing out coupons at government agen- cies and other organizations serving SNAP recipients (End Hunger Connecticut, Appalachian Sustainable Agriculture Project).
Community Partnerships between Markets, Local Organizations, and Government
Different communities interested in EBT and farmers markets ei- ther used existing partnerships, such as food policy councils or food stamp committees, or created partnerships based on the needs of a particular market and community. For example, in Los Angeles, Pompea Smith, Director of the Sustainable Economic Enterprises of Los Angeles (SEE-LA), which runs the Hollywood Farmers Mar- ket, developed a partnership with local farmers to more effectively target low-income consumers. On a larger scale, the Ecology Cen- ter of Berkeley Center in Berkeley, CA, used a partnership with the Food Security Task Force for California in order to better tailor their EBT Farmers Market Nutrition Project to the needs of food stamp recipients (Frank Tamborello, personal communication, Au- gust 6, 2009). Similarly, Iowa’s Department of Human Services developed their EBT Pilot Project as a result of a request from their Food Policy Council.
Partnerships between local organizations, social service agencies, and markets are valuable in developing an EBT program that bet- ter meets the needs of SNAP recipients. Just Harvest in Pittsburgh highlights the importance of partnerships and collaboration with human service agencies. Just Harvest also highlights the value of informing local elected officials of available services, like EBT at farmers markets, in order to provide the public with another forum to receive information. Additionally, these partnerships may also play an important role in funding solicitation, giving organizations increased access to information and opportunities to apply for ad- ditional support for their work (Ken Regal, personal communica- tion, August 19, 2009).
Coordinating with WIC Farmers Market Nutrition Program and Senior Farmers Market Nutrition Program
Many anti-hunger organizations highlighted relationships with lo-
REAL FOOD, REAL CHOICE
cal agencies facilitating nutrition assistance programs (both SNAP and WIC) and how those relationships can be used to promote EBT at farmers markets. This is particularly relevant to those mar- kets already accepting FMNP vouchers, as a very high percentage of FMNP recipients actually shop at farmers markets. Additionally, many incentive and matching programs include both the FMNP vouchers and SNAP benefits. More information on incentive pro- grams can be found in the next section.
Incentive and Other Matching Programs
Many of the markets associated with organizations providing infor- mation in the initial survey either recently received grant funding for an incentive/matching program or have been maintaining some form of an incentive program over the last several market seasons. The 2008 report titled “Nutrition Incentives at Farmers Markets: Bringing Fresh, Healthy, Local Foods Within Reach” provides an excellent overview of various pilot programs that expand the impact of SNAP benefits, as well as the WIC Farmers Market Nutrition Program (FMNP) and the WIC Farmers Market Nutrition Pro- gram vouchers (Winch, 2008).
The report also documents the experiences of the individual mar- kets implementing incentive programs. As several of these incen- tive programs have expanded, it has become clear that they can have a definite impact on the number of SNAP recipients using their benefits at the markets. For example, in San Diego County, California, the City Heights Farmers Market reported that as a result of additional support provided through Wholesome Wave FreshFund incentive program, 88% of SNAP recipients reported eating more fruits and vegetables. Additionally, 64% of individuals surveyed said they would not be able to afford to shop at the farm- ers market without the support of the FreshFund program (IRC, October 2009).
Similarly, in data gathered for the Boston Bounty Bucks program, also funded by Wholesome Wave, SNAP recipients surveyed re- ported similar experiences: 87% reported they were consuming more fresh produce as the result of the program and that they would continue to eat more produce even without the assistance of Bounty Bucks (Kim, 2010).
At the Crescent City Farmers Market in New Orleans Louisiana, a four-month pilot program funded by the Ford Foundation, W.K. Kellogg Foundation, and Kresge Foundation, allowed the sponsor- ing organization, marketumbrella.org, to match SNAP, WIC, and Senior benefits dollar for dollar. Eighteen thousand dollars were devoted to grassroots and multi-media marketing, including adver- tisements on bus shelters, gospel and Spanish language radio, and informational flyers distributed to community partners and health agencies in advance of the pilot. During the pilot period, the mar- ket saw a 600% increase in SNAP redemptions, with 440 transac-
17
tions and considerable repeat business among the 127 individual participants. SNAP shoppers continue to patronize the market in large numbers even after the pilot has finished and no match is of- fered with a residual redemption increase of 300% (marketumbella. org, 2010).
It is still unclear what long-term impact these incentive programs can have on farmers’ sales and to what degree non-financial in- centives may help address the product, cultural, price, and other barriers addressed previously in this chapter. Nevertheless, these programs have been effective in drawing more SNAP recipients to use their benefits at farmers markets.
Nutrition Education and Food Stamp Promotion
Several of the individuals highlighted the value of nutrition educa- tion in increasing awareness of farmers markets for SNAP recipi- ents. In Los Angeles, Hunger Action LA sent a nutrition educator along for the van rides with SNAP recipients to the local farmers market. Similarly, early in Berkeley’s work with SNAP EBT (2005), they worked with nutrition education programs, such as a Latino 5-A-Day program, to promote farmers markets. Other markets, such as the Anacostia Market and the Asheville City Market have offered nutrition education opportunities, tastings, and cooking demonstrations at the market, targeted at low-income customers and families. Additionally, any individual applying for nutrition assistance in Iowa watches a video at the Department of Human Services that mentions farmers markets as a location where food stamps may be used. Finally, several anti-hunger advocates have worked to promote food stamps either through a booth at a mar- ket, where individuals may begin the paperwork for obtaining food stamps, or have promoted food stamps in places such as the local senior center, while also providing information about the farmers market and the available incentive/matching programs (Atlanta Area Food Banks; Appalachian Sustainable Agriculture Project). Few of these programs have conducted surveys or other forms of evaluation on the success of these programs, but many of the orga- nizations and agencies viewed nutrition education, as well as food stamp promotion, as valuable ways to increase SNAP participants’ knowledge of and use of local farmers markets.
Online Resources
Many agencies have resources available online to support other markets interested in bringing EBT to their market. Most of the websites are state or community specific, but several provide ex- amples of flyers, brochures, and information for market managers interested in examining options for EBT. Additionally, many web- sites include specific information about their matching or incentive programs. Some examples of websites are included below:
• The Ecology Center provides a variety of resources for market managers and advocates interested in SNAP stamps and farm-
CONNECTING SNAP RECIPIENTS WITH FARMERS MARKETS
18
ers markets: www.ecologycenter.org/ebt
- The New York Farmers Market EBT/SNAP Program has de-veloped a new website documenting ongoing activities and providing information on market locations, recipes, seasonal food availability charts, etc.: www.snaptomarket.com
- The Iowa DHS website provides access to the video shown to those receiving nutrition assistance: http://www.dhs.state. ia.us/Consumers/Assistance_Programs/FoodAssistance/Farm- ersMarket.htmlAs states and community organizations continue to explore the role they can play in connecting SNAP recipients to farmers markets (as an access point for fruits and vegetables), it will be vital that they share information about best practices and resources. The web can play a valuable role in connecting interested players to the knowl- edge, experiences, and resources available in other communities.UNDERSTANDING THE SNAP LANDSCAPEThe food industry spends millions of dollars segmenting consumer types, determining how each segment makes food choices, and how to most effectively communicate with these populations. SNAP re- cipients fit into these frameworks, as do other consumer popula- tions. Nevertheless, SNAP recipients also interface with a separate set of actors related to the SNAP program and related entities. In this section, we examine the different players involved in the SNAP landscape and begin to examine the challenges in encouraging SNAP recipients to use their benefits at farmers markets.As stated above, SNAP recipients’ food shopping choices are affected by a variety of factors: individual challenges tied to transportation, convenience, and education, and broader challenges tied to federal funding and resources, federal and state regulations, and availability of community resources. These factors can be influenced in part by the organizations and agencies responsible for serving SNAP recipi- ents (or individuals eligible for SNAP) at a local level. As a result of these issues, many state agencies have increased their outreach efforts to low-income families and have increased their engagement with community partners in the application process. Yet at the same time, the agencies are “facing their own economic challenges when it comes to covering their share of administrative expenses” (USDA FNS, June 2009, p. 1). This observation also highlights the issues facing agencies and organizations working with SNAP recipients: How can state agencies and community organizations best serve and inform individuals eligible for SNAP benefits, and how can those agencies and organizations leverage federal support in conducting education and outreach? Understanding the issues facing state agencies and organizations working with current and potential SNAP recipients is essential for understanding the role these agencies and organizations can play in connecting SNAP re- cipients to farmers markets.
These organizations and agencies can be organized into five cat- egories:
DEPARTMENT OF HUMAN SERVICES (SNAP ADMINISTERING AGENCY)
State SNAP Agencies, primarily Human Services offices, are re- sponsible for promoting and processing SNAP applications within a given state. These agencies also work with other state agencies, non-profits, and even universities to develop SNAP outreach and education programs to increase the success rates of their programs and the impact for SNAP recipients. State agencies have access to funding and information that can be used as effective tools for en- gaging SNAP recipients.
COMMUNITY PARTNERS (ANTI-HUNGER, POLICY, OUTREACH, ETC.)
Community partners, ranging from anti-hunger organizations, policy organizations, outreach and faith-based organizations each play a role in serving SNAP recipients. Community partners may serve as outreach organizations, helping eligible individuals apply for SNAP benefits, or informing eligible individuals of benefits available to improve food access and opportunities for their fami- lies. They may also play a role at the markets, helping to transport SNAP eligible individuals or SNAP recipients to the market, en- gaging individuals in conversations about cooking and nutrition. Partners may be active in seeking funding for a market to obtain portable wireless EBT devices, or they may be the SNAP-Education contractor, offering classes and distributing informational materials to SNAP recipients. As these organizations work at the grassroots level, they can represent the needs of individual communities and specific populations (i.e., elderly, specific cultures). The insight of community partners in the context of how to best connect SNAP recipients to farmers markets is vital to understanding the chal- lenges facing SNAP recipients, and serves as an important resource for how to creatively engage and educate the SNAP population.
OTHER GOVERNMENT AGENCIES (AGRICULTURE, WIC OFFICES, ETC)
There is not a consistent pattern with regards to the involvement of state WIC Offices and Departments of Agriculture on SNAP and farmers markets. Both WIC and Departments of Agriculture may provide valuable insight into how to best involve SNAP recipients in farmers markets because of their experience with the WIC Farmers Market Nutrition Program and Senior Farmers Market Nutrition Programs. By recognizing the wealth of knowledge and experience available in both of these offices, SNAP administrators, as well as community partners, could greatly improve their ability to connect SNAP recipients to the resources available at farmers markets.
REAL FOOD, REAL CHOICE
SNAP-EDUCATION
According to the USDA Institute on Food and Agriculture: “SNAP- Ed is a federal/state partnership that supports nutrition education for persons eligible for the SNAP” (USDA National Institute of Food and Agriculture, 2009). SNAP-Ed was formerly known as the Food Stamp Nutrition Education Program, or FSNE. The goal of SNAP-Ed is to provide educational programs and conduct social marketing campaigns intended to encourage SNAP recipients to use their benefits to purchase healthy food items despite working with a limited budget. The program also encourages increased physical activity. State agencies that choose to conduct nutrition education through their SNAP program are eligible to be reimbursed for up to one half of their SNAP-Ed costs by USDA FNS. State and local funding primarily comes from land-grant institutions which con- tract with SNAP agencies to deliver SNAP-Ed. Other contractors are state public health departments, food banks, tribal programs, and local health organizations (USDA National Institute of Food and Agriculture, 2009)
SNAP-Ed has the potential to play a role in efforts tied to EBT and farmers markets, but there are limitations on the structure and content of nutrition education programs funded by the USDA. If a state agency does receive USDA funds for SNAP-Ed, the state agency and contractors can use those funds only for specific “al- lowable” activities (USDA FNS, 2008). In this context, farmers market promotion tied to SNAP is included under “nutrition ed- ucation” in which funded agencies can offer nutrition education and demonstrations, distribute information about market locations and hours, and highlight farmers markets as an option for getting fruits and vegetables (Melody Steeples, personal communication, September 15, 2009). The limitations on these allowable activities, however, make it nearly impossible for SNAP-Ed funded agencies to “encourage” or “promote” farmers markets over traditional gro- cery stores and supermarkets.
USDA funded agencies providing SNAP-Education is limited in terms of their ability to connect SNAP recipients with farm- ers markets. The California Association of Nutrition and Activity Programs has pointed out that current SNAP-Education allowable activities could be expanded to include public health activities and other environmental approaches that could increase the effective- ness of SNAP-Ed (CAN-ACT Policy Brief, 2009). This issue also ties directly to those organizations conducting SNAP outreach and the limitations they face in terms of allowable activities. In one interview, an individual from the Food Trust (PA) noted that the USDA regulations passed down to the states have limited what or- ganizations can do in terms of outreach and education, and in many cases, states prefer to work with organizations and other contrac- tors conducting traditional and predictable outreach, rather than creatively using the funds (Duane Perry, personal communication, February 16, 2010).
19
Additionally, if SNAP-Ed contractors are to work with markets in offering education and cooking demonstrations at farmers markets, they have to meet USDA requirements in terms of the population being served by the market. According to the Oregon Extension Service (contracted by Oregon Department of Human Services to conduct outreach in Oregon), one way states could use SNAP- Ed funding is educating at a farmers market that qualifies based on USDA targeting requirements. This could include giving out food tastes and recipes, as well as using hands-on activities to teach about eating healthy foods. The Oregon Extension Service notes that “[a]ll SNAP-Ed programming must be consistent with the US Dietary Guidelines and follow quite a few other federal guidelines.” (Lauren Tobey, personal communication, February 15, 2010). SNAP-Ed contractors must determine if a particular site is eligible for their services by following the guidelines outlined in the SNAP- Ed guidance plan. This would likely be most relevant at markets serving lower-income populations (where at least 50% of the per- sons visiting the venue have gross incomes at or below 185% of the poverty guidelines (USDA FNS, 2008). Increasing the awareness of these guidelines by market managers and non-profits working with farmers markets could lead to a better understanding of how SNAP-Ed organizations can work more closely with markets serv- ing USDA targeted populations.
As noted by John Camp, the Administrator of Washington’s Food Assistance Program, in a survey conducted for Washington Pilot Project report, SNAP recipients in Washington stated that they chose to visit Washington Farmers markets in part because of the “cooking demonstrations and recipes” available at markets (Wash- ington DSHS, 2010). If those SNAP recipients are reflective of SNAP recipients across the country, increased partnerships between SNAP-Ed contractors and qualified markets could increase the ap- peal of shopping at farmers markets for SNAP recipients, while leveraging currently available resources.
SNAP OUTREACH
As mentioned earlier in this chapter, the SNAP program serves as the foundation for America’s nutrition assistance program, yet many individuals who are eligible to receive benefits (such as se- niors and working people) are not participating. This not only has implications for those individuals’ ability to afford to eat healthy foods, but also has indirect impacts on the local economy. As noted in the State Outreach Plan, “every $5 in new SNAP benefits gener- ates $9.20 in additional community spending” (USDA FNS, 2009, p. 1). SNAP Outreach seeks to inform and increase access to the program for individuals eligible to receive SNAP benefits. SNAP outreach funding may also be used to ease the application process, providing support for individuals who may need extra assistance in applying for benefits. States submit a state outreach plan to the FNS for approval and may be reimbursed for 50% of administrative fees associated with SNAP outreach. There are also SNAP outreach
CONNECTING SNAP RECIPIENTS WITH FARMERS MARKETS
20
grants available to individual community organizations interested in serving SNAP eligible individuals. Although the role of outreach in the SNAP program has fluctuated since its creation, the 2008 Farm Bill reinvigorated emphasis on SNAP outreach, and today President Obama’s FY2011 budget includes even larger increased funding for the SNAP program, with emphasis on promotion, out- reach, and demonstration projects (FRAC, 2010).
Although there are no direct connections between SNAP Outreach and farmers markets, there are opportunities within SNAP Out- reach funding to better inform potential SNAP recipients of the opportunities available at farmers markets, as well as opportunities for community organizations to conduct SNAP outreach at mar- kets in low-income areas. This, in turn, could help increase the awareness of markets as a shopping option within SNAP and po- tential SNAP populations
|
SNAP-EDUCATION |
SNAP OUTREACH |
|
|
USDA ROLE AND PROCESS |
1. States that choose to conduct nutrition education through their SNAP program are eligible to be reimbursed for up to 50% of their costs by USDA FNS. States must submit an application to receive funds each year. 2. States develop a nutrition education plan, using the guid- ance document available through the FNS. States also use FNS developed nutrition education materials. 3. When states receive their funding, states then contract with land-grant universities, and other organizations to offer nutrition education. 4. The contractors then serve both current SNAP recipients, as well as individuals that could be eligible for SNAP (i.e., individuals living under 130% of the federal poverty lev- el). Any SNAP-Ed effort must be aligned with the Dietary Guidelines |
1. States submit their outreach plans to FNS each year, in which states can receive reimbursement for 50% of their administrative costs. Community and faith-based organizations may serve as contractors under the state outreach plan. 2. FNS also provides some grants to non-profit orga- nizations and others to improve access to nutrition as- sistance programs. There are not currently any grants to include references to farmers markets listed on the FNS website. |
|
STATE LEVEL PARTIES |
• Land-Grant Universities (in 48 states) |
• State Agencies (Department of Human Services) • Non-profits/Community Organizations |
|
Examples of Allowable Activities Include: Purchase of FNS nutrition education/promotion materials that address SNAP-Ed topics, purchase of other materials when no FNS materials on that topic are available, local radio and television announcements of nutrition education events, social marketing campaigns targeting areas/venues where at least 50% of population is below 185% of the pov- erty line, food samples associated with nutrition education lessons, classes on nutrition related topics (i.e., food budget- ing, preparation). (SNAP-Ed Plan Guidance, 2008) |
Examples of Allowable Activities Include: Eligibility pre-screening, application assistance, place- ment of advertisements on radio, television, print or electronic media, outreach exhibit at booth at com- munity event, outreach workshops with community organizations, development of printed educational or informational materials for clients, etc. (Outreach Plan Guidance, 2009) |
WHERE SNAP PARTICIPANTS AND FARMERS MARKETS MEET
The SNAP program provides essential support to millions of Americans, playing a vital role in the food security of low-income
individuals and families. To a much more limited degree, SNAP educates the population about the importance of making healthy food choices. Consumer food shopping choices take into account a wide array of variables related to convenience, selection, price, and personal preference. SNAP participants’ choices tend to be restrict-
REAL FOOD, REAL CHOICE
ed by such factors as store location, access to transportation, more limited time available for shopping, and price sensitivities.
As discussed in this chapter, farmers markets present real and perceived barriers for widespread patronage by SNAP recipients. Community organizations and state agencies across the country are working to creatively overcome barriers to SNAP and farmers markets in order to improve food choices for the SNAP population in their communities. Federal programs such as SNAP-Education
21
and incentive programs have the potential to increase SNAP par- ticipants’ awareness and patronage of farmers markets. Whether the SNAP program is able to do more to entice beneficiaries to shop at farmers markets depends in part on whether USDA, and the interest groups that interact with USDA, perceive the program to be about income support or about nutrition assistance. Bringing SNAP users to the market is only a portion of the system. Enabling markets to serve the needs of SNAP participants presents its own set of challenges and opportunities.
CONNECTING SNAP RECIPIENTS WITH FARMERS MARKETS
22
CHAPTER IV. The Farmers Market View of SNAP Transactions
In the late 1980s, Katherine Lewis from Dunbar Gardens was accept- ing food stamp coupons at Pike Place Farmers Market. “For us, we got paid with paper food stamps and had to give appropriate change: under a dollar in real money, and any other change in food stamps. I used to keep the $1 denomination food stamp so that I’d have them if I needed them for change. It wasn’t like we got a lot of them, and there were some other coupons issued by Pike Place back then as well, and then the WIC coupons started, so it’s hard to remember each item clearly.”(personal communication, February 4, 2010)
As we saw in Chapter III, successful farmers markets serving SNAP clients do not operate on a “Field of Dreams” model: “build it and they will come.” They take a lot of outreach, organizing, and modi- fying to meet the needs of the shoppers. Similarly, it is not just a matter of equipping markets with wireless terminals to ensure a successful EBT program. The terminals are just a starting point. Staffing and funding is needed to operate the system, and the right system needs to be tailored to each market’s needs and abilities. As we addressed in Chapter II, farmers markets have a wide range of staffing capacities, and as such, different models will be applicable to individual markets. This chapter will examine the experiences of various markets using those divergent models and conclude with a discussion on the future of EBT at farmers markets.
INTRODUCTION
Before jumping to the 21st century technology of wireless ma- chines, it is appropriate to recognize the farmers markets that have continued to serve SNAP shoppers using the manual voucher sys- tem. At Washington State’s Mount Vernon and Ballard farmers markets, managers continue to use this appropriate technology method which is cost-effective for their particular farmers market setting (R. Ordonitz, J. Kirkhuff, personal communication, March 23, 2010). Though some feel this process creates an unpleasant and stigmatized shopping experience for SNAP shoppers, others say that it all depends on the community setting and the degree to which SNAP shoppers feel welcome in the farmers market environ- ment. Such an atmosphere is created by the market manager, the producers, and community volunteers. Many farmers markets are proud that they have found an affordable way for the market to continue to be of service to all community members.
WIRELESS SERVICES IN FARMERS MARKETS
Before wireless technology became commonplace, many socially- conscious farmers market organizations volunteered to use a man- ual voucher system in which the SNAP participants’ information was handwritten and the market staff on-site used cellphones to secure an authorization number that placed a hold on the shopper’s funds. After the market, the manager would mail the coupons for reimbursement or enter the information on a hardwired machine. This time-consuming yet inexpensive system is still used in small farmers markets with relatively few SNAP transactions.
CENTRAL-TERMINAL WIRELESS PROGRAM
Farmers market organizations that have assumed the responsibility of operating a SNAP EBT machine have developed various meth- ods for facilitating and tracking the transaction between the SNAP client and the farmer. These methods include issuing alternative currencies such as tokens or paper scrip, or creating a receipt sys- tem. Until recently, FNS required that all farmers markets apply for an alternative currency waiver (see Chapter VI). These alternative currency options in many ways mimic the multiple step redemp- tion process of the obsolete food stamp coupons. The markets must have the capability to accept returned SNAP tokens if requested by the SNAP shopper. It should be noted, however, that based on conversations with market managers, SNAP shoppers rarely return the tokens.
Alternative Currency Model A: Tokens/Paper Scrip
Under this model, the SNAP client purchases tokens (such as wood- en nickels) or paper scrip of equal value to be used for purchases at the market. Traditionally $1 scrips are designated as SNAP scrip and the $5 scrip are for debit and credit cards. This distinction is required by USDA FNS in order to track federally funded dollars (SNAP) and regular commercial dollars. In addition, FNS rules state that vendors cannot provide change to SNAP scrip. The $1 scrip is like cash at the market, with the exception that they can only be used for SNAP-eligible products. After the market is over, the vendors trade the scrip with the farmers market organization for cash. SNAP tokens are different in color and denomination from tokens sold to debit/credit card users to reduce confusion among vendors as to which scrip can be used for which products.
A small percentage of SNAP scrip are not redeemed, either be- cause they were not spent by the customer, or vendors failed to return them for reimbursement. From an accountant’s perspective, outstanding SNAP and debit/credit tokens are a liability on the farmers market’s balance sheet. Some farmers markets now include an expiration date on the scrip which would allow for a periodic conversion or transfer of outstanding SNAP tokens dollars to the ownership of the markets to avoid farmers markets being account- able for these residual funds in perpetuity.
REAL FOOD, REAL CHOICE
Alternative Currency Model B: Paper Receipt Process
To eliminate the handling and tracking of scrip, some markets choose to use a paper receipt system. With a paper receipt system, the SNAP shopper selects products from a vendor, who sets the selected foods aside and gives her a receipt. The SNAP client takes the receipt to the market information booth, where a trained opera- tor processes the sale on the farmers market wireless machine and stamps the receipt. The SNAP shopper then returns to the vendor and exchanges the validated receipt for her previously selected food items. Subsequently, the vendor redeems the validated receipt with the farmers market organization on the same market day.
From an accounting point of view, this system is much more ef- ficient because the market handles all of the accounting and re- imbursements to vendors at the market. However, some farmers feel the system is cumbersome and complain that they lack space in their booth for the customers’ shopping bags. Many markets are also concerned that SNAP-only paper receipts puts an unfair burden on SNAP shoppers.
However, other markets such as Chicago’s Green City Market did not receive negative feedback from the SNAP shoppers once they understood the system (D. Rand, personal communication, Febru- ary 2, 2010). In the Lawrence Farmers Markets (MA), and Til- lamook Farmers Market (OR), both SNAP and debit/credit card shoppers use this system. In a Farmers Market Coalition listserv exchange, Lawrence Farmers Market Manager Janel Wright stated her enthusiasm for a receipt-based system, as it “allows for the exact amount to be debited from EBT/credit/debit cards, and there’s no extra ‘currency’ in circulation” (personal communication, March 16, 2010).
DEBIT AND CREDIT CARD TRANSACTIONS
One auxiliary effect of introducing SNAP/EBT machines in farm- ers markets is the opportunity to offer bank debit card and/or credit card transactions with the same machines. The early wireless adopt- ers such as New York’s farmers market only offered SNAP. As tech- nology improved, farmers markets began adding debit and credit cards services. Debit and credit card sales have easily surpassed SNAP sales. Farmers markets soon began charging a convenience
IOWA EBT WIRELESS PROJECT
23
fee (much like an ATM would) on debit sales, or deducted three to five percent from the vendors’ debit and credit card sales to cover operating costs. The debit/credit card revenues and fees collected are the main income source to offset EBT transactions (15-25 cents each) and monthly fees. The fees cover operating expenses, but to date, not the additional labor cost to implement the program. These additional card sales and revenue streams have become the more compelling reason why farmers markets invested in wireless technology.
Tokens have taken on a life of their own as a marketing tool. There is an element of fun to this alternative currency, as well as a rein- forcement of the local economy. Local businesses use them for employee incentive programs, or groups such as Elder Hostel buy them for visitors to eat and shop in the market (D.S. Ruff, personal communication, 2006). Though this is an increasingly popular way to bring people to the market, the unintentional consequence is that the more tokens issued, the more tokens there are to count, requiring more paid or volunteer staff. Successful token programs are becoming increasingly burdensome to farmers market manage- ment.
FARMER-OPERATED WIRELESS PROGRAM
In Iowa, Jan Walters, the EBT Manager at the Department of Hu- man Services, recognized that the predominantly small Iowa farm- ers markets did not have the organizational infrastructure to man- age a market level Central-Terminal wireless program. In 2005, Iowa DHS used available SNAP administrative funds to purchase equipment, and continues to use these funds to support the proj- ect. Currently, Iowa pays for leased or rental machines fees, SNAP transaction fees, and SNAP related monthly fees (farmers pay debit and credit card related fees). The funding for the EBT Wireless Program is part of a regular 50/50 match on SNAP administra- tion. After five years, 167 SNAP authorized farmers are selling in 118 farmers markets, and the program is now part of the on-going DHS SNAP budget (J. Walters, personal communication, February 26, 2010). One of the primary advantages of this farmer-operated model is that it eliminates the challenges of managing tokens and providing staff. In the 2009 Iowa EBT Wireless Project newsletter, Walters shared the history of the EBT and total sales.
|
CALENDAR YEAR |
2005 |
2006 |
2007 |
2008 |
2009 |
5 YEAR TOTAL |
|
TOTAL CARD SALES* |
$19,775 |
$210,614 |
$516,290 |
$724,703 |
$834,298 |
$2,305,678 |
|
EBT SALES |
$1,423 |
$18,524 |
$39,733 |
$41,845 |
$62,078 |
$163,603 |
|
EBT AS % OF CARD SALES |
7.2% |
8.8% |
7.7% |
5.8% |
7.4% |
7.1% |
*Total Sales include SNAP, Debit and Credit Cards (Iowa Department of Human Services, 2010)
CONNECTING SNAP RECIPIENTS WITH FARMERS MARKETS
24
The report also documented that half of the 167 producers’ aggre- pendently adopt SNAP and will continue to need state subsidies to gate sales of SNAP, Debit, and Credit cards were less than $1,000 incorporate SNAP/EBT into their businesses.
in 2009. At this sales volume, farmers have little incentive to inde-
IOWA EBT WIRELESS PROJECT PRODUCER SALES, 2009
|
SNAP, DEBIT & CREDIT CARD SALES IN 2009 |
$0- $500 |
$501- $1,000 |
$1001 – $3,000 |
$3001 – $5,000 |
$5,001 – $10,000 |
$10,001 – $20,000 |
$20,001 – $60,000 |
$60,001 – $75,000 |
$75,001 OR GREATER |
|
NUMBER OF PRODUCER/ VENDORS |
60 |
24 |
25 |
15 |
13 |
14 |
7 |
0 |
2 |
(Iowa Department of Human Services, 2010)
In another example, in 2001, the Federation of New York Farm- ers Markets pioneered wireless technology by providing terminals to farmers in New York City’s Greenmarkets. Diane Eggert, the Federation’s Executive Director, provided extensive assistance to the farmers as they learned about the new technology. Despite the chal- lenges with a lack of transmission infrastructure causing dropped signals, the program outcomes were promising.
The Federation and state partners, however, saw SNAP sales in farmers markets remain relatively flat. In 2005, they decided to move towards a Central-Terminal model, which provided an op- portunity for more farmer participation and reduced operating costs by having only one terminal per market. Though sales in- creased significantly, Iowa and New York have the same percentage of SNAP participation in farmers markets, 0.015% versus 0.0154 % respectfully.
More importantly, over the past two years, the Federation worked with the SNAP administrators and local community partners to coordinate a SNAP outreach program to build SNAP shopper participation in farmers market. Last year, SNAP sales climbed to $833,000, up from $325,000 in 2008. However, other factors besides the campaign contributed to this increase including an increase in SNAP caseloads and more farmers markets accepting EBT.
This coordinated effort with state and local DHS agencies was es- pecially noted by Michael Hurwitz at the NYC Greenmarket. In a Farmers Market Coalition webinar, Hurwitz commented that SNAP sales increased 30% within two weeks after a local SNAP office included EBT-friendly farmers market locations in a SNAP participant mailing.
DISCUSSION OF VARIOUS MODELS
As wireless technology evolved and became more accessible, many
(D. Eggert, personal communication, February 25, 2010)
more farmers market organizations have implemented this “Cen- tral-Terminal” SNAP model. However, inserting the market orga- nization as a middleman in these transactions creates administrative and accounting challenges, costs, inconveniences, and liabilities for the market organization because it requires the organization to:
1. Incur the expense of acquiring the EBT machine and service contract;
2. Develop and maintain accounting systems to track the flow of money from the point of the SNAP transaction;
3. Reconcile sales transfers from the SNAP clients’ bank account into the farmers market bank account;
4. Issue checks to each individual farmer from whom the SNAP client has purchased SNAP eligible foods;
5. Add and manage staff (volunteer or paid) to operate the EBT machine during market hours, as well as invest two to four after-market hours each week to fill out market day sales re- ports, count tokens, and reconcile monthly statements.
In the Farmers Market Coalition SNAP survey administered to state farmers market organizations, 96% of respondents stated that staffing the program was the biggest challenge. In Michigan, the Michigan Farmers Markets Food Assistance Partnership de-
REAL FOOD, REAL CHOICE
termined that the average annual costs associated with accepting Michigan’s SNAP Bridge Cards at farmers markets was $2,500 per year, or 55% of total cost of operating the program.
AVERAGE ANNUAL COSTS ASSOCIATED WITH ACCEPTING BRIDGE CARDS AT FARMERS MARKETS
25
unsustainable and farmers markets will struggle to fill those jobs with trained volunteers. In New York, farmers markets engage local food banks to run the EBT program (D. Eggert, personal com- munication, February 11, 2010). However, smaller communities have a smaller pool of community partners to help implement the program. Denise Miller, Executive Director of the New Mexico Farmers Market Association, stated: “It is very difficult for rural areas to find business partnerships to support capacities like these at markets” (FMC SNAP Survey, December 2009).
The Davis Farmers Market in Northern California, widely recog- nized as a flagship market in the region, currently does not offer SNAP, debit, or credit card services. However, the farmers market does own an ATM machine located in a permanent market booth on-site. The machine cost $1,200, comparable to the cost of a Point of Sale (POS) wireless machine. The market manager stocks the machine with $20 bills every week. In 2009, the machine dis- pensed $500,000, which generated $15,000 in ATM fees that the market could reinvest into outreach and overhead expenses (R. Mc- Near, personal communication, February 28, 2010).
In California, the Department of Health Services provides free SNAP-only wireless machines, and pays for the associated fixed transaction fees as long as the retailer generates a minimum of $100 in SNAP sales per month (Sarah Nelson, personal communication, December 16, 2010; USDA FNS, 2010). Unlike Iowa, California’s wireless machines are not programmed for debit and credit transac- tions. However, the combination of free SNAP machines and an on-site ATM machine shows potential to minimize the financial burden felt in other farmers markets.
Based on the SNAP survey and follow-up interviews, the follow- ing chart summarizes the shoppers’, farmers’, and farmers markets’ view of the farmers-operated and central-terminal model.
|
COSTS |
PERCENTAGE OF TOTAL ANNUAL COSTS |
|
Staff |
55.07% |
|
Other |
11.54% |
|
Point of Sale Devices |
8.33% |
|
Alternative Redemption System |
8.08% |
|
Telephone |
5.55% |
|
Materials |
4.01% |
|
Monthly Fees |
3.85% |
|
Transaction Fees |
3.08% |
|
Electricity |
0.49% |
(Michigan Farmers Markets Food Assistance Partnership, 2010).
To overcome staffing limitations, farmers markets often find suc- cess recruiting community partners to manage the machine on-site at the market. AmeriCorps and Vista volunteers have been excep- tionally helpful in staffing a number of markets across the country. This pool of volunteers may grow substantially as the National Ser- vice Corps now has a Healthy Futures Vision, and numerous enti- ties are seeking to develop food-related AmeriCorps programs (Per- sonal communication, Gus Schumacher, May 20, 2010). The New Mexico Farmers Market Association, for example, pursued grants and funding from the Department of Health Services to help pay volunteers’ stipends. In the long term, such grant funding is likely
CONNECTING SNAP RECIPIENTS WITH FARMERS MARKETS
26
REAL FOOD, REAL CHOICE
COMPARISON OF CENTRAL-TERMINAL AND FARMER-OPERATED EBT WIRELESS PROGRAMS
EACH VENDOR HAS EBT/SNAP-ONLY MACHINE
2)Sales credited directly to bank account
4) Increase in sales may not cover machine costs
Relieves organization from inconvenience/ expense of operating machine
2) Market must ad- vertise which vendors accept SNAP
Convenient
FARMERS MARKET OPERATES ONE EBT/SNAP-ONLY MACHINE IN COM- BINATION WITH A TOKEN/SCRIP OR RECEIPT SYSTEM
1) Small increase in sales
2) Receipt system re- quires paper receipt and placing items on hold at farmer’s booth
1) Can advertise that shopper can purchase from all vendors who sell SNAP eligible products
3) Labor cost to operate machine and account- ing system
2) Receipt system is less inconvenient
POSITIVES
NEGATIVES
POSITIVES
NEGATIVES
POSITIVES
NEGATIVES
1) Small increase in sales
3) Slows transaction time at each stand
1) Some vendors may choose to not partici- pate
2) Vendors may increase prices to cover expense of machine
3) Same machine for multiple locations
5) Increases prices to cover machine costs
3) Stigmatized transac- tion for other shoppers if vendor does not accept debit and credit cards
2) Token/ scrip system as fast as cash transac- tions
2) Same machine
can be used by same organization at multiple locations
4) Additional manage- ment duty for market manager
All vendors selling SNAP eligible products can capture SNAP federal dollars
3) Perceived as unfair burden in SNAP Only markets
FOR THE VENDOR
FOR THE FARMERS MARKET ORGANIZATION
FOR THE SNAP CLIENT
1) Cost of machine
2) Cost of service contract
1) Some vendors may not participate
6) Appears vendor ac- cepts debit/credit cards
1) Inconvenience of redeeming tokens/scrip or receipts
1) Machine cost
2) Service contract cost
1) Token/scrip system is inconvenient
3) Tokens/scrip & receipt fee – percentage of vendors debit/credit card sales
5) Service fees to farm- ers may not cover costs
4) Distinctive SNAP tokens
6) Requires market person to provide ID and SS# for FNS Permit
THE FUTURE OF SNAP IN FARMERS MARKETS
The rate of growth in the number of farmers markets accepting EBT in recent years has outpaced the increase in SNAP sales, in- dicating that expanding the number of farmers or farmers markets accepting EBT is only part of the solution to increasing SNAP sales in farmers markets. Accepting SNAP is not the best option for ev- ery farmers market. Many markets are not located in trade areas in which there are substantial numbers of SNAP recipients. There may be other nearby markets that do a better job of serving SNAP recipients.
For those markets that currently do or could potentially serve a SNAP clientele, much can be done to publicize farmers markets and to make them a more attractive shopping option. Many of these options are described in detail in the 1999 CFSC publication, “Hot Peppers and Parking Lot Peaches,” which focuses on how to create successful markets that serve low-income communities. New York’s decision to focus on marketing to SNAP shoppers paid off with significant sales for the farmers. Although these increases are not entirely due to the campaign, it does show how a statewide col- laborative and local promotion can benefit both the SNAP shop- pers and farmers markets.
Collaboration with public and non-profit partners can play an es- sential role in fostering SNAP sales at markets. Diane Eggert noted that the key to expanding SNAP in farmers markets in New York is building strong relationships with the regional USDA field rep- resentative and the state SNAP administrator. As Minneapolis’ for- mer Midtown Farmers Markets Market Manager David Nicholson
27
argues, other organizations (such as public health entities) should be responsible for recruiting SNAP recipients to farmers markets: “Remove the burden of administration and promotion from re- source-scarce farmers markets in particular because they have no way of benefiting from implementing SNAP” (FMC SNAP Survey, December, 2009).
While not all farmers market managers share this view, David Nicholson’s point is well taken, and leads back to a key issue from Chapter II. What is the social responsibility of farmers markets? Given that at their root they are a place for an economic transaction to occur between producer and consumer, how many other social aims can be placed on them?
From a strictly short-term financial perspective, there is sometimes limited economic incentive for individual farmers or farmers mar- ket organizations to offer SNAP/EBT-only services. The relatively few transactions and low dollar amounts that markets see in the first couple years, in the absence of incentives or targeted outreach campaigns, make the costs and inconvenience of offering this ser- vice uneconomical. Even with California’s state subsidies, only 10% of farmers markets in the state offer SNAP/EBT.
The Farmers Market Coalition estimates that between 40 and 45% of their member farmers market organizations are recognized as 501(c)(3)s by the IRS. This subset of markets may be predisposed to prioritize SNAP integration even when, in the short term, it requires a higher expenditure of resources than it brings in through SNAP redemptions.
SELECTED STATE SNAP PROGRAMS AND PARTICIPATING FARMERS MARKETS
|
STATE |
WIRELESS MACHINES |
SNAP TRANSACTION FEES |
MONTHLY WIRELESS FEES |
# OF CURRENT PAR- TICIPATING FARMERS/ FARMERS MARKET |
|
California |
Paid by state SNAP agency |
Paid by state SNAP agency |
Paid by state SNAP agency |
51 farmers markets |
|
Iowa |
Paid by state SNAP agency |
Paid by state SNAP agency |
Paid by state SNAP agency |
167 farmers |
|
New Mexico |
Paid by state SNAP agency |
Paid by state SNAP agency |
Paid by state SNAP agency |
6 farmers markets |
|
New York |
Paid partially by state funds and grants |
Paid by state SNAP agency |
Paid by farmers markets |
135 farmers markets plus some farmers |
(See Appendix C for a full table including the 15 selected states)
If SNAP EBT is offered in combination with debit and credit card sales, or if the market secures partnerships with community orga- nizations to take on operating, recordkeeping, or promotion re- sponsibilities, then point of sale (POS) wireless terminals become economically attractive.
However, as consumers continue to move away from the use of cash to debit or credit cards for their food purchases, a farmer unwilling to offer electronic transactions may be left behind. General Coun- sel of California Federation of Farmers Markets Dan Best states, “Greater emphasis should be put on farmers and produce vendors
CONNECTING SNAP RECIPIENTS WITH FARMERS MARKETS
28
to get individually authorized and having their own wireless devices. There has to be more responsibility given to the farmer or produce vendor (the actual party to the transaction). Again, they obviously are not going to ever assume this responsibility if someone is going to do it for them. They could provide EBT in every market they sell in, including those without any present existing market system. It won’t be long before WIC goes entirely electronic. Complexity will only be compounded” (D. Best, personal communication, Febru- ary 10, 2010).
Not all farmers markets share the view that farmer-operated SNAP is either realistic or efficient, even in the long-term. For one, there will always be seasonal producers who elect not to adopt EBT tech- nology, meaning that not all vendors in a given market are acces- sible to SNAP shoppers. This makes the task of outreach and pro- motion to the SNAP community that much more challenging for market organizations.
Farmers markets and farmers are already feeling these complexities with SNAP, WIC/Senior Farmers Market Nutrition Program, and
the new WIC Cash Value Voucher program. Additionally Michi- gan is currently a pilot state for a new EBT WIC card, WIC Bridge Card. The Michigan Farmers Market Food Assistance Partnership graphically demonstrates the USDA Food Nutrition Services pro- grams that are flowing into the farmers markets.
It is uncertain what the future entails for EBT in farmers markets, especially as new wireless products enter the marketplace. What we do know at this time that interest in SNAP in farmers markets is increasing. However, the pace of adopting SNAP in farmers mar- kets is challenged by the complexity of the programs and the often fragile farmers market organizations. Last year Michigan Farmers Market Association offered three EBT workshops around the state. The high number of registrations for the workshop required the organizers to schedule an additional training. In 2010, only ten farmers markets registered, so the workshop format changed to a webinar. These indicators are important red flags that advocates for SNAP in farmers markets need to apply best practices and be aware of the challenges that farmers markets raise in this report.
This schematic was created by the Michigan Farmers Markets Food Assistance Partnership to demonstrate all the programs, agencies and people that we collaborate with to improve consumers’ access to fresh, healthy produce.
(Michigan Food & Farm Partnership, 2010)
REAL FOOD, REAL CHOICE
CHAPTER V. The Role of State and Local Leadership in Fostering SNAP Usage at Farmers Markets
States and municipalities can play an important role in supporting the use of SNAP at farmers markets through a variety of means including legislation, programmatic leadership, and facilitating co- ordination among state agencies and other entities. As part of the research process for this report, staff contacted agencies in 14 states to determine their level of involvement in promoting SNAP usage at farmers markets. This chapter will examine how four states (New York, California, Massachusetts, and Iowa) exerted leadership to catalyze EBT usage at farmers markets. It will continue with a look at recent legislation passed in Washington, Illinois, and California to support the SNAP-farmers market connection.
PROGRAMMATIC LEADERSHIP: THE TALE OF FOUR STATES
Iowa: Program Integration with State Structure and Farmer-Run EBT Program
Iowa serves as a unique model in encouraging SNAP recipients to shop at farmers markets. As mentioned in Chapter III, Iowa estab- lished its EBT Wireless Project in 2005, providing wireless devices to individual farmers for processing EBT transactions. The EBT Wireless Project was developed in response to the Iowa Food Policy Council in 2004, which requested that Iowa DHS restore the abil- ity for SNAP recipients to use their benefits at farmers markets (Jan Walters, personal communication, August 26, 2009). Iowa decided to use a farmer-run EBT system, in part, as a result of interviewing farmers market managers and farmers about which strategy would work best for them. From the market managers’ point of view, they did not want to dedicate time to extra bookkeeping, or selling and redeeming tokens or scrip. The farmers indicated that they would prefer that their wireless sales go directly into their bank accounts, without the extra redemption process required with tokens or scrip. All of the stakeholders felt that sales would not be lost if they were conducted on the spot, quickly and simply. From the beginning, Jan Walters, the Iowa Department of Human Services EBT Direc- tor, championed a promotion plan to re-introduce SNAP shoppers to farmers markets. Walters was also a strong advocate for protect- ing the farmers from unnecessary financial burdens, seeking ways to lower the impact of the EBT system on the individual farmer. One way Walters addressed this issue was by partnering with the Iowa Farm Bureau for the first three years of the project, in order
29
to help promote and pay the farmers’ fees for debit and credit card transactions. Walters made a strong effort in terms of promotions, acknowledging, like in New York, that it would take repeat efforts and resources to educate, or re-educate, SNAP shoppers about us- ing their benefits at farmers markets (Jan Walters, personal commu- nication, February 8, 2010). Some examples of promotion efforts conducted in Iowa include:
• Mailing brochures to each DHS county office for distribution to SNAP recipient households. The brochure contained infor- mation about all the markets in Iowa that had at least one farmer with wireless equipment, including operating hours and addresses.
• Displaying posters at each DHS office that listed farmers mar- kets in nearby communities.
• Utilizing the DHS website as an outreach tool, including pro- viding a DVD about farmers markets, copies of monthly farmers market newsletters, and information on the markets where SNAP households could use their benefits (Walters, 2010).
Iowa has also consistently gathered data from farmers market shop- pers, using farmer distributed customer service cards, as well as the farmers themselves, in order to most effectively serve their custom- ers and the markets themselves.
Today, Iowa has 167 farmers in 118 farmers markets across the state participating in the program. They generated $62,000 in SNAP sales in 2009, as compared to $41,845 in 2008. All wireless sales in- cluding debit and credit cards totaled $834,298, up from $724,703 in 2008. In the 2009 Annual Iowa EBT Wireless report, 55% of the farmers reported making more money at the market than in 2008. 67% reported an increase in sales because they accepted EBT and 47% reported more EBT sales in 2009 than in 2008. Ninety percent increased their sales because they accepted debit and credit cards (Walters, 2010).
While the EBT program is now part of the on-going DHS bud- get (which is matched 50/50 by the USDA Food and Nutrition Service), Iowa has not been able to maintain its level of funding for outreach efforts. Iowa’s experience exemplifies what is possible in terms of coordination and marketing in the context of a state SNAP agency. It also provides an example of a state that has been able to integrate their EBT and farmers market program into their human services state agency.
Massachusetts: Public-Private Partnerships
When the Commonwealth of Massachusetts recently allocated $50,000 for the promotion of SNAP at farmers markets through
CONNECTING SNAP RECIPIENTS WITH FARMERS MARKETS
30
the Massachusetts Department of Agricultural Resources (DAR) and Department of Transitional Assistance (DTA), its leaders turned to non-profit partners for their guidance. DTA and DAR leaders contacted the Federation of Massachusetts Farmers Markets (FMFM) for advice. Jeff Cole, Executive Director of FMFM, re- calls that his first response was: “What’s needed first is the funding of terminals. Second, is funding of operation of the redemption process at market” (Personal communication, March 18, 2010). The Federation volunteered to serve on a joint task force evaluating wireless terminal systems in order to provide guidance to manag- ers interested in EBT. Following that work, FMFM was invited by Wholesome Wave Foundation to partner to expand their Double Value Voucher Program and to produce other incentives for the underserved communities in the state. This work led to a collabo- ration with The Food Project, The Boston Public Market Associa- tion, the City of Somerville, Union Square Main Streets, The City of Cambridge, The City of Boston, and the Boston Public Health Commission. These collaborating organizations and agencies sup- ported FMFM’seffort to provide EBT at every farmers market in Boston and Somerville and as many markets in Cambridge as feasi- ble through the DTA/DAR grant. However, grant requests were in excess of available funds. After successfully partnering with Whole- some Wave in 2009, FMFM was involved in a joint effort to access private funds through Wholesome Wave and The Harvard Pilgrim Health Care Foundation to further support the DAR/DAT grant. Private funds were added, and administered by FMFM in order to provide 100% funding to all grant applicants.
The grants will provide markets with funds to purchase or rent wireless terminals, up to $200 for costs associated with SNAP trans- actions for the wireless terminals, as well as promotional costs and for incentive dollars for one year. Although the Federation recom- mended that funds also be authorized to cover staffing costs (which Cole noted are the most daunting costs for successful SNAP imple- mentation), limited overall funding caused the DAR to ultimately decide against these recommendations. The program stipulates a maximum of $2,500 for any individual market, or $10,000 for any one organization managing multiple markets, none of which can be used to cover labor costs. Cole added that based on his obser- vations to date, “{the markets that have successfully incorporated EBT are ones that are run by community nonprofits who have other financial and in-kind resources” (personal communication, March 18, 2010).
Remaining private funds will be used to shore up incentive projects where needed and to produce “Veggie Prescriptions” in conjunc- tion with the Ceiling And Visibility Unlimited (CAVU) Founda- tion and health care clinics partnering with CAVU to implement and evaluate various practices dealing with juvenile diabetes and obesity.
This level of inter-agency collaboration is a promising example for other states where resources in one agency alone are not sufficient to tackle a challenge that clearly addresses mutual priorities.
New York: Agency and Community Partnerships and City-Run EBT Program
“SNAP administrators need to recognize the costs of the program, both in dollars and in staff resources, and find ways to provide funding to markets that are interested in participating in the program, providing fresh, healthy foods to SNAP consumers. The financial assistance will encourage greater market participation and ultimately help to build a healthier population” (New York OTDA, personal communication, February 4, 2010).
As with many other nutrition assistance programs, New York has set the pace for states working with SNAP/EBT and farmers markets. Its success can be traced in part to the leadership of Bob Lewis, Chief Marketing Representative at the NY State Depart- ment of Agriculture and Markets (NYDAM). Lewis has played an instrumental role in developing and ensuring the success of farmers markets in low-income communities in New York City and other parts of the state. His advocacy helped to ensure that New York received a disproportionately high share of Farmers Market Nutri- tion Programs, which led to the creation and success of such ‘cou- pon markets’ as Washington Heights in Upper Manhattan and Poe Park in the Bronx. As NY State’s food stamp program transitioned from paper coupons to EBT about a decade ago, Lewis worked tirelessly with the banking sector to develop new technologies and programs to ensure that farmers markets would not be left out. In one instance, he considered advocating for portable ATM machines that food stamp users could get ‘market bucks’ from upon insert- ing their EBT cards. He worked closely with state government and the farmers market community to implement pilot programs that would continue to allow New York State food stamp users to re- deem their benefits at farmers markets. Perhaps more than any oth- er state agency official, he has used his position within government to advocate for programs and policies that meet the food access needs of SNAP users and of small direct-marketing farmers.
In 2001, the New York Department of Agriculture & Markets (NYDAM) and the Farmers Market Federation of New York (FM- FNY) teamed up to try the new wireless handheld EBT terminals with farmers. In this first program, they provided terminals for 24 farmers in New York City’s Greenmarkets. At the time, the termi- nals alone cost $1,400 each. As noted by Diane Eggert, it became apparent early in the process that it would take time to educate and re-educate SNAP recipients that they could once again use their benefits to buy fresh produce directly from the farmer. The Depart- ment of Agriculture and Farmers Market Federation had little sup- port from community partners or state agencies to foster outreach. During these early programs, the farmers relied on their food stamp
REAL FOOD, REAL CHOICE
customers to spread the word.
According to Eggert, this process was slowed by the technology itself. Using the terminals was unreliable and time-consuming in a fast-paced market. Many farmers opted to not use the terminal for these reasons. Additionally, others were so apprehensive about their own competency to operate the terminals correctly, or were afraid of the terminal being stolen, that they left the terminals at home rather than risk loss.
As the number of farmers at the markets increased, the Farmers Market Federation began to consider alternative ways to manage the increasingly labor intensive program. In 2005, the Federation changed the focus of the EBT program from a farmers-operated terminal model to a central-terminal model. By providing the ter- minals to the markets, as opposed to individual farmers, the Farm- ers Market Federation believed that more SNAP dollars would be available to more farmers and that SNAP shoppers would be able to shop with all vendors who carried SNAP eligible products. In order to make this program successful, the Farmers Market Federation and Department of Agriculture engaged a number of community partners to assist with the program. These community partners in- cluded: Anti-hunger non-profits, food pantries, food banks, rescue missions, and faith-based organizations. These partners became crucial to supporting the work of the farmers markets, such as in conducting EBT transactions or counting tokens, as well as con- ducting outreach at farmers markets for SNAP.
In addition, the Federation worked with the New York Office of Temporary and Disability Assistance (OTDA) to develop a broad outreach campaign to SNAP recipients, further connecting with community level organizations and departments, such as WIC of- fices, local health departments, and the Office of Aging. The Fed- eration and OTDA also worked with SNAP-Ed contractors in New York State (Cornell Cooperative Extension) in conducting nutri- tion education at eligible markets. As these programs have grown, the New York State Farmers Market Federation has developed a larger circle of service providers on a state and regional basis. This led to the creation of a website, www.snaptomarket.com, which in- cludes an outreach brochure that helps educate food stamp recipi- ents and service providers. New York Farmers Market Federation plans to launch an email campaign to inform community partners of the resources available on the SNAP-to-market website (New York OTDA, personal communication, February 4, 2010).
The New York OTDA reported that it “[w]ould be difficult, if not impossible, for New York’s markets to participate in the food stamp program without the financial support that is provided by OTDA.” OTDA staff also commented: “Food stamp customers have been excluded from farmers markets for a number of years… shopping habits, as well as eating patterns, have been established. It takes a
31
great deal of promotion to change behavioral patterns.” This is an important factor to consider as other states attempt to move for- ward with their EBT programs.
In addition, New York OTDA staff had two final recommenda- tions on the role of SNAP administrators in supporting outreach to SNAP recipients including:
• Continuing to fund promotional efforts at the state level (in- cluding coordinating with the farmers market federation in producing ads, posters, press releases, and web promotion).
• Recognizing the value of coupon incentive programs as a way to bring SNAP recipients together with farmers markets. “While running the NY Fresh Check program in 2008, ful- ly 1/3 of food stamp consumers came to the market for the first time because of the incentive, and continued to shop at the market once they found the prices reasonable, the quality and variety exceptional, and the experience was positive for themselves and their families.” (New York OTDA, personal communication, February 4, 2010).
New York serves as a strong example of the value of partnerships be- tween state agencies and local organizations in implementing pro- grams, such as SNAP/EBT and farmers markets. It also serves as an example of a state successfully using a central-terminal model.
California: Inter-State Learnings Lead to Change
In the summer of 2000, Frank Buck, staff to the California Nutri- tion Network, a branch of the California Department of Health Services, took a fact-finding trip to Santa Fe, New Mexico to better understand the workings of the Santa Fe Farmers Market EBT Pilot Program. Food stamps and EBT were under neither Buck’s purview nor the Department of Health Services. They were managed by the California Department of Social Services. The Nutrition Net- work was supported by USDA Food Stamp Nutrition Education funds, and in turn granted funds to schools, public health agencies, and numerous community based organizations around the state for health promotion activities tailored to low-income communities. Nevertheless, because Buck and his department chief Sue Foerster understood the importance of farmers markets in health promo- tion, they decided to dedicate their attention to finding ways to keep farmers markets as eligible sites for redeeming food stamps once they went electronic.
In the next four years, Buck was appointed to committees over- seeing the implementation of EBT, acting as an advocate for the continued inclusion of farmers markets as food stamp vendors. When the banking company that won the contract for managing the EBT program in the state agreed to provide terminals only for the top ten food stamp-redeeming farmers markets, Buck was able
CONNECTING SNAP RECIPIENTS WITH FARMERS MARKETS
32
to put pressure on them to expand this commitment dramatically. Eventually, the Nutrition Network hired Berkeley Farmers Market Manager Penny Leff to assist markets across the state to implement EBT.
The State of California EBT Farmers Market Program started as a demonstration program in 2003 to support EBT in non-traditional markets. Today, the program is now implemented statewide, and current participation includes a growing number of farmers mar- kets, individual produce stands, fish vendors, and flea markets.
In 2009, the California Healthy Food Access Consortium was awarded $500,000 to serve six metropolitan areas: San Diego, Los Angeles, Fresno, Monterey, Oakland, and San Francisco. The Con- sortium, fostered by Roots of Change (ROC), is presently work- ing to encourage the purchase of eligible specialty crops by SNAP, senior, and WIC clients at farmers markets. In a press release about the project, ROC President Michael Dimock said, “This project will scale up an initial International Rescue Committee/Whole- some Wave Foundation pilot program in San Diego County and demonstrate how local, state, and federal government can partner with our farmers, nonprofits, and philanthropies to improve com- munity health through better nutrition and sustainable foodshed development” (Roots of Change, 2010).
In addition to increasing redemptions of WIC FMNP and WIC Cash Value Vouchers, the project aims to increase SNAP expendi- tures on eligible specialty crops at 17 farmers markets with access to incentive programs (including nine new markets), and will support “double voucher” incentive programs at 33 markets. ROC notes that by merely increasing SNAP redemption rates at farmers mar- kets by one half percent, $13 million in new revenue would result for participating farmers.
State Level Policy Change
In addition to leadership exercised at the state agency level, elected officials across the country have started to focus on the integration issue. There have been a number of bills passed or introduced in the past few years. Below are some legislative highlights.
CALIFORNIA
California, which already boasts twice the national average rate of SNAP redemption at farmers markets, is taking a different ap- proach. With support from organizations like the Agriculture and Land Based Training Association (ALBA) and San Diego Farmers Market, California Assembly member Juan Arambula (D-31) in- troduced a bill, A.B. 537, which would add an act to the Welfare and Institutions Code relating to public benefits. The bill would require farmers markets “that do not have an EBT system in place by January 1, 2012, to designate or assign an interested Food Nu-
trition Service (FNS)-authorized organization to operate an EBT acceptance system in the market, as specified. The bill would re- quire the State Department of Social Services to consider and solicit input from the market prior to making a designation or assignment authorized under the bill, to avoid potential conflicts, as specified” (California General Assembly, 2010). This bill, which still requires Senate review, is not without its critics. Several iterations of the pro- posed legislation were aimed to appease those who felt that it rep- resented an unfunded mandate to market organizations that may not have the resources to comply. This sentiment was addressed in the last portion of the bill, stating:, “Nothing in this section shall be interpreted to require a market described in subdivision (a) to itself create, operate, or maintain an EBT acceptance system on behalf of its produce sellers.” Amended on January 25, 2010, the bill was passed by the Assembly two days later. In February, the bill was referred to the Senate Human Services Committee, where it is still pending review at this writing.
WASHINGTON
In October 2008, Washington passed SB 6483, the Local Farms, Healthy Kids Act. This legislation provided funding to enable farm- ers markets to accept food stamps, increase funding for the Farm- ers Market Nutrition Programs (FMNP), and created three pilot projects for food banks to purchase fresh food directly from Wash- ington farms. Within the bill, the Department of Human Services allocated $50,000 for 20 markets to receive a wireless POS terminal and funds for supplies and marketing materials. An advisory group was formed by the Washington State Farmers Market Association to assist in the planning of the pilot project.
This advisory group developed a mini-grant application process, provided outreach templates to farmers markets, developed finan- cial reporting forms, and created training materials. In addition, the advisory group researched third party processors and determined they would use one provider for all grantees. DHS interpreted the law broadly and did require all farmers markets to accept credit cards. Data collected at the end of the season showed that credit cards sales were 50% of all card sales at the 20 grantee farmers mar- kets. With this $50,000 investment by the State of Washington, the participating markets generated $46,349 in SNAP, $93,140 in debit, and $157,440 in credit cards through the new wireless ma- chines in their 2009 market season.
One important component of the Washington Pilot Project was gathering data about how SNAP shoppers perceive their shopping experience. While conducting research for their Farmers Market Technology Improvement Pilot Program, Washington DSHS gath- ered information on why SNAP shoppers choose one location over another. This important documentation showed the following out- comes:
REAL FOOD, REAL CHOICE
- SNAP shoppers perceived farmers markets as more expensive than local grocery stores
- SNAP shoppers surveyed noted that farmers markets are not as convenient as local grocery stores due to their limited market days and hours
- Those SNAP shoppers stated that they choose to shop at farm- ers markets because:
o They perceive the nutritional value of locally produced food to be higher;
o They appreciate the education they receive from the farm- ers and markets, such as recipes and cooking demonstra- tions;
o They like the greater variety available at the farmers market;
o The markets share their personal values and they want to support local growers.
ILLINOIS
Modeled partly after the Washington legislation, HB 4756, the Farmers Market Technology Improvement Program Act, was passed by both chambers of the Illinois legislature on April 27, 2010. This
33
act directs the Department of Human Services and the Depart- ment of Agriculture to implement a Farmers Market Technology Improvement Program. The purpose of this program is “to increase access to fresh fruits and vegetables and other LINK eligible food products, including quality meat and dairy, for all Illinois residents by allowing LINK program participants to redeem their SNAP benefits at farmers markets” (State of Illinois, 96th General Assem- bly, 2010). Although the bill creates a Farmers Market Technology Improvement Fund as a special fund in the state treasury to imple- ment the program, the Department of Human Services and the Department of Agriculture are directed to solicit federal and state monies for deposit into this fund, to be used for:
- The purchase or rental of wireless point of sale terminals ca- pable of processing SNAP benefits disbursed under the LINK program.
- Monthly or transaction fees associated with LINK card trans- actions. No fees related to credit or debit transactions will be reimbursed.
- Outreach to LINK program participants.As written, the legislation would become effective July 1, 2010, and implemented by March 31, 2011.
CONNECTING SNAP RECIPIENTS WITH FARMERS MARKETS
34
CHAPTER VI.
The Policy Context – Programs, Current Events, & Future Recommendations
Since President Obama came into office in January 2009, the na- tion has seen many unprecendented interest in healthy foods and local food systems. In the past fifteen months, local and regional food systems to the passage of historic health care reform legis- lation. In the past 15 months, local food systems have come to the forefront at the USDA and the White House, and have been an area of growing interest among the American People, with the planting of the first White House Garden since Eleanor Roosevelt’s Victory Garden during World War II, the launching of USDA’s Know Your Farmer, Know Your Food Initiative, and the introduction of the First Lady’s Let’s Move initiative. This is only a sampling of the Administration’s recent efforts surrounding the advancement of local food systems.
While the demand for locally grown food is steadily increasing and local food production is one of the fastest growing segments of U.S. agriculture, it still accounts for a small share of total domestic food sales (USDA Economic Research Service, 2009). This leads to con- cerns about both the available supply of local food versus the de- mand for such products and about the issue of equitable access. As discussed in previous chapters, not all individuals, especially those of lower socioeconomic status, have access to local food sources, such as farmers markets. This chapter explores how USDA and the current administration are working with federal nutrition programs to increase access to healthy, local foods for all people across the country. It will explore efforts within USDA to increase access to local foods, such as in the Food and Nutrition Service branch that is responsible for the administration of the SNAP program, as well as in the Agricultural Marketing Service branch that is responsible for the administration of the Farmers Market Promotion Program (FMPP). The chapter will also delve into several new initiatives currently underway, and end by exploring current challenges and emerging issues that will lead to possibilities for change and poten- tial policy recommendations.
USDA FOOD AND NUTRITION SERVICE
As mentioned previously, USDA Food and Nutrition Service (FNS) is responsible for the administration of the SNAP program. According to FNS staff interviewed for this report, it has long been a goal of the agency to encourage SNAP customers to shop at farm- ers markets, and to find innovative ways to increase SNAP partici-
pants’ access to nutritious foods and farmers markets. Additionally, FNS has expressed a commitment to providing resources to farm- ers markets nationwide, and to increasing the number of farmers markets licensed to accept SNAP benefits. In a webinar on April 20, 2010 hosted by FNS, ‘’Putting Healthy Food Within Reach: SNAP Educational Webinar Series,’’ Jessica Shahin, Associate Ad- ministrator for SNAP, stated that FNS plans to license at least 200 additional farmers markets each year to accept SNAP benefits, and to facilitate an increase of at least $750,000 in SNAP redemptions at farmers markets. Adding a SNAP payment option at farmers markets has not always been easy, but FNS has recently streamlined the application process, thus making it easier for farmers markets to become approved SNAP retailers.
In May 2010, FNS unveiled an online SNAP Retailer Locator on its web site, which allows SNAP participants to search and find au- thorized merchants within a radius of their home. In press release, FNS Undersecretary Kevin Concannon said “the SNAP Retail Lo- cator will make it easier for SNAP participants, especially those who may be new and unfamiliar with the program, to gain access to food. The new resource is another critical step in improving access to SNAP by providing participants with information to make more informed shopping choices.”
STREAMLINING THE SNAP RETAILER APPLICATION PROCESS
Historically, becoming an authorized SNAP retailer has been an ar- duous process for farmers markets as they do not typically adhere to the same ‘brick and mortar’ structure as more permanent retailers. In recognition of the burden this was placing on farmers markets and on SNAP state agencies, FNS has recently taken several steps to address these regulatory challenges.
In November 2009, USDA FNS added a section to their website called ‘’Accepting SNAP Benefits at Farmers Markets2,” with the goal of more clearly explaining the process of becoming a SNAP retailer to farmers market entities. Since its introduction, this portal has undergone several upgrades, and FNS sources report that they will continue to improve the site and simplify the process for farm- ers market applicants.
Subsequently, on February 24, 2010, USDA FNS headquarters is- sued a memo to all FNS Field Operations Directors throughout the United States detailing new procedures for the implementation of scrip and incentive programs at farmers markets. Traditionally, it was required that Farmers Markets submit waiver requests for the following steps in the application process:
2http://www.fns.usda.gov/snap/ebtfm.htm
REAL FOOD, REAL CHOICE
- 1) Alternative Redemption Systems. Otherwise known as scrip (including tokens or receipt-for-purchase), Alterna- tive Redemption Systems are essential for nearly all mar- kets using a central market terminal rather than letting each individual farmer manage their own EBT-equipped Point of Sale Device. All markets using scrip of any kind were directed to apply with their State SNAP Agency for approval of such systems.
- 2) Equal Treatment Clause. According to §278.2(b) of the Food Stamp Program Regulations, “Coupons shall be ac- cepted for eligible foods at the same prices and on the same terms and conditions applicable to cash purchases of the same foods at the same store,” meaning that SNAP recipients cannot be subject to different treatment or pric- es from regular paying customers, regardless of whether this treatment benefits or discriminates against the SNAP recipient. Due to this regulation, any market intending to operate an incentive program to provide SNAP shop- pers with matching funds (i.e., ‘double dollars’ program), was required to complete a waiver application with their State SNAP Agency.
Recognizing the additional paperwork and time burden this placed on both the Market and the State Agency, USDA decided to elimi- nate the requirement for these waivers. In the aforementioned memo, Jeff Cohen, Director of the Benefits Redemption Divi- sion at FNS, spelled out these new procedures for farmers markets SNAP retailers:
In the interest of streamlining the implementation of farmers market scrip and bonus incentive projects, this memorandum removes State agencies from the approval process. Farmers markets will no longer be required to submit proposals or an- nual reports to operate scrip or bonus incentive projects unless as otherwise required by the funding organization.
As a result, farmers markets operating scrip or token programs with a wired or wireless central point-of-sale (POS) device must now simply inform their respective FNS Field Operations Office. Simi- larly, markets intending to implement a privately-funded incentive program to provide SNAP recipients with matching dollars for SNAP purchases must also inform the appropriate FNS Field Op- erations Office. Provided that a farmers market abides by all SNAP rules and regulations, no other reports will be required. With this new policy, state SNAP agencies are no longer required to request a waiver from FNS for farmers markets to operate alternative re- demption or incentive programs in their state, approve farmers market proposals for such projects, or collect transactions of other data from farmers markets operating these projects.
OBTAINING EBT TERMINALS
Unfortunately, becoming an authorized SNAP retailer is not the only key to accepting SNAP EBT at farmers markets. One bar- rier that has repeatedly been reported among USDA, advocates, and farmers markets alike is the difficulty in obtaining a wireless EBT terminal. Currently, USDA regulations only require the state agency to provide free point-of-sale EBT devices to markets that conduct $100 or more in SNAP sales per month, and that have a central location with electricity and a phone line. If a market does not possess access to both of these items, then the state agency is not required to provide them with an EBT terminal. Consequently, many farmers markets do not qualify for these free EBT terminals.
Alternatively, markets can choose to operate a manual process, in- volving a phone to verify and hold available funds, or purchase or lease a wireless EBT point-of-sale device. A wireless EBT point- of-sale device also accepts debit and credit cards and can be used at multiple locations operated by the same farmers market orga- nization. In most states the market will need to obtain these de- vices through an independent third party processor and will be responsible for all service/lease, card provider, and transaction fees. According to the federal rule, states do have the option of using administrative program funds to provide wireless terminals to mar- kets; however, many choose not to do so due to the higher cost of the wireless terminals. While the cost differential between hard- wired and wireless terminals is shrinking, it may nevertheless be a challenge for cash-strapped state agencies.
In an effort to address the need for wireless EBT devices, USDA officials worked with the President to include a proposal of $4 mil- lion for equipping farmers markets with wireless EBT point-of-sale devices in the President’s FY 2011 budget. Alhough not all of the details have been worked out to date, this is an important first step in the budget process, providing Congress with an outline of the Administration’s priorities. USDA recognizes that simply provid- ing wireless EBT devices will not solve all of the challenges farmers markets face in accepting EBT, but they believe it is a positive step in the right direction. It is also a step that will help initiate further conversations around the issue.
DATA CHALLENGES
In the course of the research, some discrepancies were noted be- tween the data collected by state farmers market organizations and that collected by FNS offices. Such discrepancies are visible both in the number of markets authorized to accept SNAP and the to- tal dollar amounts redeemed in 2009. Causes for such discrepan- cies include the fact that FNS may be including individual farm- ers (who might conduct SNAP transactions on-farm as well as at farmers markets), may consider an organization operating several markets with SNAP as one retailer, and potential miscoding of self-
CONNECTING SNAP RECIPIENTS WITH FARMERS MARKETS
35
36
identified farmers markets. In fact, one miscoding was revealed in New Mexico in which a grocery store SNAP retailer was inadver- tently coded as a farmers market. When the error was identified, FNS corrected their initial report of $171,436 in farmers market SNAP sales in New Mexico to $12,870.97, a difference of more than 1200%. The extent to which other states’ data may be sub- ject to inadvertent miscoding (or erroneous self-identification) is not clear. Data errors are par for the course, but accurate informa- tion is crucial to establish valid baselines and enable stakeholders to compare like information across states and over time. More field research (as FNS has recently initiated through their field offices), and cross-checking with AMS data and state farmers market leaders is needed to verify that entities classified as farmers markets actually fit the definition as established by FNS.
At the time of this writing, FNS Field Offices have been directed to contact all farmers market SNAP retailers to verify that their opera- tions are appropriately coded.
SNAP STATE EXCHANGE FUNDS
In the context of administrative streamlining, FNS has also recently developed the ‘’Guide for State Agencies on Improving Access to the Supplemental Nutrition Assistance Program,’’ which offers policy and procedural recommendations for income eligibility, re- porting, technology improvements, and improved accessibility for applicants (USDA Food & Nutrition Service, 2010). While farm- ers markets are not referenced anywhere in the 42-page document, State SNAP agencies are encouraged to “use State exchange funds to travel to other States and learn how those States are improving access to SNAP in their communities.”
State Exchange Funds were first made available in 1983 as part of FNS’ Operation Awareness Campaign (Stansfield, 1984), and can only be used to cover travel costs associated with State SNAP agency personnel visiting other states to see first-hand innovations in technology implementation, certification, and other program administration logistics. These funds, which are available through regional FNS offices, could be a boon for state agencies looking to learn from innovations in SNAP implementation in farmers mar- kets. Depending on the region’s priority planning goals and fund availability, several states may be able to collaborate on a conference that could allow local SNAP personnel to learn from colleagues in an interactive atmosphere.
SNAP EDUCATION AND OUTREACH
As discussed in detail in Chapter III, SNAP Education and Out- reach are the primary means by which SNAP recipients are in- formed of SNAP and how benefits can be used. Both SNAP Edu- cation and Outreach funds can be used to increase awareness of farmers markets, but in order to be eligible to access these funds, a
farmers market must enter into a contract with the State Agency or partner with an entity that does so. In past years there has not been as much emphasis on SNAP Education or Outreach funds, but the 2008 Farm Bill brought a renewed focus to these programs as does President Obama’s FY 2011 budget proposal, which includes increased funding for the SNAP program, with emphasis on pro- motion, outreach, and demonstration projects (FRAC, 2010).
Prior to 2004, SNAP-Ed (previously called the Food Stamp Nutri- tion Education Program, or FSNEP) included five core elements, including dietary quality, food security, food safety, shopping be- havior/resource management, and systems and environmental change. Unfortunately, in 2005, USDA removed the core elements of “food security” and “systems and environmental change,” thus reducing the ability of agencies to address the issue of food acccess and to support changes that make healthy food more available to food stamp recipients. They did so in an effort to target funds toward food stamp recipients and away from broader population- based approaches. Many public health groups and FSNEP stake- holders were highly critical of this change in direction, believing that the changes would lead to ineffective and limited nutrition education practices.
Such stakeholders interested in reinstating the two removed ele- ments mentioned above approached Congress for assistance. This effort resulted in the inclusion of Congress’ expectations around SNAP-Ed in report language attached to the 2008 Farm Bill. The report accompanying the legislation included language that sup- ports public health approaches to promote healthy eating and physical activity behavior change. According to ‘SNAP-Ed – Doing More of What Matters,’ a publication of the California Association of Nutrition and Activity Programs:
The Farm Bill Report provides clear expectations from Con- gress regarding SNAP-Ed activities. The inclusion of the phrase ‘the combined application of public health approach- es and education’ clearly indicates Congress’ desire for SNAP- Ed funds to be used broadly and effectively. Standard pub- lic health functions applicable in changing nutrition and phys- ical activity practices include monitoring nutrition related behaviors, educating participants around healthy diet and ac- tivity practices, mobilizing partnerships to solve access and other problems, developing policies and plans to support de- sired behaviors, linking target population to programs and services, and evaluating the impact of overall efforts on intend- ed outcomes.
To date, FNS has not adopted new guidelines that reflect the Con- gressional intent as signaled in the aforementioned report language. They have in effect maintained that report language does not carry sufficient weight to make USDA change policies.
REAL FOOD, REAL CHOICE
At the same time, the Senate Agriculture Committee has proposed to cut SNAP-Ed funds by $1.2 billion over 10 years to fund im- provements in the Child Nutrition Act. The Committee’s proposal would eliminate the entitlement status of SNAP-Ed, thus putting a cap on the total amount of funds that states would be eligible to re- ceive. Under this new proposal, funds would be adjusted annually for inflation and disbursed to states based on a funding formula. Additionally, the requirement for matching funds would be elimi- nated, thus reducing an administrative burden on states. Finally, legislative changes would allow the funds to be used for food se- curity-type activities. Congressional leaders have warned that the program is in jeopardy of elimination in the next Farm Bill unless action is taken now.
INCENTIVES TO DEVELOP HEALTHY HABITS
With promotion and outreach being among farmers markets’ big- gest challenges in drawing SNAP customers, programs designed to incentivize usage of benefits at farmers markets are expanding in number and scope (see Chappter III). The Wholesome Wave Foundation has emerged as a leader in the granting of double dol- lar funds for individual farmers markets, and expects to expand to 20 states by 2011 (M. Nischan, personal communication, Febru- ary 26, 2010). Individual markets in California, New York, Wash- ington, Maryland, Connecticut, Florida, the District of Columbia, and many others have succeeded in securing funds for doubling the value of SNAP benefits redeemed at markets (Winch, 2008). Some, as in Washington, DC, provide ‘double dollars’ for any nutritional program, including WIC and Senior Farmers Market Nutrition Programs (FRESHFARM Markets, 2010). Because these innova- tions are relatively new, their ability to transform first time farmers market SNAP shoppers into loyal customers over time is not yet known, but it is clear that these incentives do draw SNAP par- ticipants to markets for at least an initial visit. Wholesome Wave reports that, in markets where they have helped implement incen- tive programs, SNAP redemption rates increased anywhere from 300% to 600% (Nischan & Schumacher, 2010). Peer -reviewed, consistent analysis with a public health emphasis may help lend credibility to the promise of such initiatives.
Thankfully, the evidence is already strong enough to convince Con- gress to further explore the issue. The Healthy Incentives Program (HIP), created from the 2008 Farm Bill, supports pilot projects that help FNS evaluate the use of healthy food-purchasing incentives in the Supplemental Nutrition Assistance Program (SNAP). One state will be selected from a competitive application process to provide incentives at the point of purchase to encourage households partici- pating in the SNAP to purchase fruits, vegetables, or other health- ful foods, and include “an independent evaluation that uses rig- orous methodologies, particularly random assignment, to produce scientifically valid information on the impact of the pilot” (USDA Food and Nutrition Service, 2009). The evaluation will measure
37
the impact of this incentive on the purchase and consumption of healthy foods by SNAP households. Such evaluation will provide much needed rigor and credibility to examining the hypothesis that incentives do have the power to improve eating habits and result in increased SNAP redemptions at farmers markets over time.
In January 2010, FNS began soliciting letters of intent to apply from state SNAP agencies. According to Greg Walton, Grants Of- ficer in USDA FNS, letters of intent were submitted by 14 states, including Florida, Pennsylvania, Washington, Michigan, Arizona, Maine, Delaware, New York, Massachusetts, Iowa, Connecticut, Colorado, California, and Wisconsin (personal communication, March 9, 2010). While the program will likely work mainly with retailers, there may be a natural fit to incorporate incentive pilots at farmers markets, if applicants so choose. In fact, the Request for Applications makes a point of referencing farmers markets.
All SNAP authorized retailers in the selected Pilot area or serv- ing HIP participants must be invited to participate in HIP if they typically sell the targeted fruits and vegetables directly to households such as conventional retail establishments and farmers markets…Ideally, the selected Pilot area will have a broad representation of retailers including supermarket chains, independent retail grocers of all sizes, convenience stores and at least one farmers market (USDA Food and Nutrition Ser- vice, 2009).
At the time of this report, USDA was still in the site selection pro- cess, but the authors verified that at least one state, Massachusetts, did submit a proposal incorporating farmers markets, with signifi- cant input from the Federation of Massachusetts Farmers Markets.
FNS reports that they are looking to the Healthy Incentives Pilot project to provide some solid data on the issue of providing incen- tives to SNAP participants, and the agency will likely not consider this issue on a national level until the evaluation of the pilot project is completed. Unfortunately, it does not appear that the project and its evaluation will be completed in time to inform policy rec- ommendations for the 2012 Farm Bill. In the meantime, USDA is looking for additional independent research from communities implementing similar initiatives.
While incentive programs do provide consumers with increased purchasing power, they have been approached with some hesitancy by the anti-hunger community due to the “good food versus bad food” debate. The issue of good food versus bad food in SNAP originally emerged many years ago in the appropriations process when Representative Tim Johnson (IL) introduced legislation di- recting the Secretary of Agriculture to develop a list of good foods that would be acceptable for SNAP purchases. Any food not on the “good food list” could not be purchased using SNAP benefits.
CONNECTING SNAP RECIPIENTS WITH FARMERS MARKETS
38
While that distintion has yet to be legislated, it has continued to be proposed in recent pieces of legislation, including the 2008 Farm Bill, recent Agriculture Appropriations, and Health Care legisla- tion. The current Secretary of Agriculture, Tom Vilsack, has publi- cally opposed such changes to the program, yet they continue to be proposed. There are many advocates in favor of such legislation, though others are sensitive about the ‘slippery slope’ of restricting choice for SNAP participants and their families by defining what is ‘healthy’ or ‘nutritious.’ Recent emphasis on obesity prevention initiatives will likely bring this debate to the forefront of Farm Bill 2012 discussions.
Further research may help clarify whether creative non-financial in- centives implemented at the local level could help address some of the myriad other challenges to SNAP shoppers identified in Chap- ter III.
USDA AGRICULTURAL MARKETING SERVICE
USDA’s Agricultural Marketing Service (AMS) administers pro- grams that facilitate the efficient, fair marketing of U.S. agricultural products, including food, fiber, and specialty crops (USDA, AMS 2009). Within AMS there are several divisions representing the supply side – one of which is the Farmers Markets and Local Food Marketing Division. According to the AMS website, ‘’[f]armers markets are an integral part of the urban/farm linkage and have continued to rise in popularity, mostly due to the growing con- sumer interest in obtaining fresh products directly from the farm’’ (USDA, AMS 2009). As a result of this growing consumer interest, farmers markets have increased dramatically over the past decade, prompting the creation of federal programs such as the Farmers Market Promotion Program (FMPP).
Farmers Market Promotion Program
FMPP was created in 2006 through an amendment to the Farmer- to-Consumer Direct Marketing Act of 1976 to help improve and expand domestic farmers markets, roadside stands, community- supported agriculture programs, agri-tourism activities, and other direct producer-to-consumer market opportunitites. In its first year the program was provided $1 million in funding, but in the 2008 Farm Bill funding became mandatory, and was expanded to $3 mil- lion for fiscal years 2007 and 2008, $5 million for 2009 and 2010, and $10 million for 2011 and 2012. Additionally, in the 2008 Farm Bill, it was mandated that at least 10% of funds in any given grant year be applied to support the use of electronic benefits transfer for federal nutrition programs at farmers markets and community-sup- ported agricultural enterprises. To date, the program has exceeded this mandate with approximately 30% of grant awards used to sup- port new or existing EBT projects (a total of 65 funded EBT proj- ects) since 2006. This infusion of funds for EBT has allowed many communities to improve access to fresh fruits and vegetables and
increase income opportunities for farmers.
Despite increased funding, the program has only been able to fund 15% of the total applications received since 2006. In 2009, 86 projects were funded, yet an additional 110 proposals were rec- ommended to be funded by grant reviewers. Looking at the chart above, it is easy to see that the demand for this program clearly exceeds the available funding.
FMPP AND TECHNICAL ASSISTANCE
Unlike the Community Food Projects (CFP) administered by the National Institute of Food and Agriculture (formerly the Cooperative State Research, Education, and Extension Service), FMPP does not have a technical assistance program. AMS has taken steps to simplify the application process including pro- viding a pre-assessment tool and additional documents to as- sist in completing the application package. They also conduct workshops at regional conferences and webinars that explain the program and walk potential applicants through the grant process. AMS staff report that this has been very helpful reduc-
Source: (C. Humphrey. personal communication, April 1, 2010)
ing the number of questions staff receive during the application process, but they would like to be able to do more.
An FMPP technical assistance program could provide eligible ap- plicants with proposal resources or grantees with best practices, robust market evaluation tools, or mentors that could all serve to maximize long-term success. The successful implementation of SNAP at farmers markets requires far more than the provision of wireless point-of-sale devices. Technical assistance for new markets to implement programs and funding for existing markets to do the required outreach, recordkeeping, and evaluation are needed more so than mere short-term infusions that cover only technological costs. This is the missing link that could dramatically increase the rate of SNAP redemption at farmers markets. In order to be able to provide such assistance, the FMPP legislation would need to be
REAL FOOD, REAL CHOICE
changed to require program staff to provide technical assistance through public-private partnerships, and to use a percentage of the total funding (CFP uses 10%) to cover the associated costs. Be- cause of the unusual overlap between AMS’ goal to support farmers markets and FNS’ goal to support nontraditional SNAP retailers, FNS could interject additional funds that would cover technical assistance for EBT-related projects.
Data and Evaluation of Farmers Markets
Currently, AMS staff is working to compile case studies from proj- ects previously funded through the FMPP, beginning with 2006 grants which were completed in 2008 and 2009. Follow-up will continue with subsequent completed. The goal of this strategy is to review which projects (not just EBT-related projects) worked, which did not work, and why. At the time of publication, AMS staff were conducting interviews with grant recipients from the 2006 funding cycle, with plans to continue the process with all funding cycles. Additionally, the Office of Management and Bud- get plans to release a new evaluation form in 2011 for all USDA grant programs requiring awardees to provide both qualitative and quantitative project outcomes. This will likely be in addition to the current required FMPP evaluation measures. While such evalua- tion metrics will not be EBT-specific, there may be opportunities for AMS and FNS to partner on the identification of recommend- ed indicators.
AMS also maintains a national directory of farmers markets, which is now used annually to tally farmers markets state by state. In re- cent years, AMS has devoted increased energy to the accuracy and completeness of this database. One component of this listing is whether a given market accepts SNAP, WIC FMNP, and/or Senior FMNP. Because this directory is based on self-reporting, however, the numbers differ considerably from those documented by FNS, which include individual farmers and market networks using one SNAP permit for multiple markets.
In 2009, AMS published the first National Farmers Market Survey, based on data collected in 2006 (Ragland & Tropp, 2009). The survey asks market managers, among other things, about partici- pation in federal nutrition programs. Only 6.8% of respondents reported participation in SNAP during the 2005 season, which the authors acknowledge is partly due to the associated hardware, maintenance, transaction, and training costs. This survey, which has been revised for implementation again in 2010, will offer a helpful triangulation with existing FNS and AMS data on SNAP at farmers markets.
FMPP Expansion
While FMPP is one of the most successful grant programs within USDA, one of the resulting challenges for FMPP staff is the con-
39
tinuing expansion of the program. Currently the program is run by six staff members, and with biannual funding increases since 2006, the staff find it hard to keep up with the administrative needs of the program. The yearly funding increases has provided the ability to finance more projects, but this has also led to a disproportionate increase in the number of applications received. Thus the adminis- trative time spent sorting through submitted applications has also been amplified. With the increased number of grantees, there is more paperwork to track and more time spent monitoring projects. With funding expected to double again next year from $5 million in 2010 to $10 million in 2011 and 2012, these administrative costs are also expected to increase further.
Presently, the Office of Management and Budget (OMB) within USDA determines the amount of funding allocated to cover ad- ministrative costs. To date OMB has not allowed any dollars to be taken from the annual FMPP funding to be used for such purposes. According to current FMPP staff, it is difficult to estimate exactly what resources will be needed to review, manage, and evaluate an increased number of grants, which are sure to accompany the dou- bling of the budget in 2011.
EBT Handbook for Farmers Markets
In 2009, USDA AMS engaged in a partnership with the Project for Public Spaces to publish Supplemental Nutrition Assistance Program (SNAP) at Farmers Markets: A How-To Handbook, which was devel- oped with the guidance of an advisory group representing farmers markets, merchant service providers, and USDA staff. The USDA has scheduled this publication for release in the summer of 2010. As a technical guide to implementation, it aims to demystify the steps required by the Food and Nutrition Service to becoming a SNAP authorized farmers market, illustrate the process of operat- ing alternative redemption systems (such as scrip or tokens), and offers suggestions about outreach and promotion. Once available and disseminated throughout the farmers market community, it could serve to encourage interested markets to adopt SNAP in 2010 and 2011.
NEW HEALTHY FOOD INITIATIVES: WHERE DO FARMERS MARKETS FIT IN?
The convergence of healthy eating and local agriculture is a high- profile priority. One in three people has diabetes and for the first time in history this generation of children is expected to have a shorter life-span than their parents. At a time when obesity has cer- tainly reached epidemic proportions, many Americans are interest- ed in increasing access to healthy foods. The Obama administration has made access to healthy foods a high priority with the launching of USDA’s Know your Farmer, Know your Food Initiative, the First Lady’s Let’s Move campaign, and several line items in the President’s FY 2011 budget proposal. This section will explore many of these
CONNECTING SNAP RECIPIENTS WITH FARMERS MARKETS
40
new healthy food initiatives in greater detail and how farmers mar- kets fit into the equation.
Know Your Farmer, Know Your Food
In Fall 2009, USDA launched the Know your Farmer, Know your Food (KYF2) Initiative, an interdepartmental collaboration de- signed to find innovative ways to support local farmers, strengthen rural communities, promote healthy eating, and protect natural re- sources. While the KYF2 initiative itself is not a tangible program, it is working within USDA to catalyze change and started with two basic goals in mind: (1) to support local/regional food systems, and (2) to strengthen the connection between producers and consum- ers. Upon introducing the initiative, Deputy Secretary of Agricul- ture Kathleen Merrigan created the Know Your Farmer, Know Your Food Team comprised of USDA agency heads from across the De- partment. This team meets on a regular basis to brainstorm and de- velop ways to include agriculture in all 15 USDA feeding programs and to expand access to healthy food. One example of an effort to include local food systems into a federal feeding program is farm to school. The Farm to School Initiative was developed out of the KYF2 Initiative in response to the growing interest and demand for farm to school activities among school districts and communities.
Another product of the KYF2 Initiative is increased awareness of existing USDA programs that can be used to further local food sys- tems. In August 2009, Deputy Secretary Merrigan released a memo in which she outlined exisiting Rural Development Programs that could be used to further local food systems.
Additionally, President Obama requested each of USDA’s 26 agen- cies to identify programs that could be used to help reinvigorate local food systems. Now, the KYF2 website (http://www.usda. gov/knowyourfarmer) outlines existing USDA programs that can be utilized for each of the initiative’s four focus areas: supporting local farmers, strengthening local communities, promoting healthy eating, and protecting natural resources. The recent launch of the Economic Research Service’s Food Environment Atlas is an inter- active illustration of the power of collaboration across the depart- ment, and these kinds of projects are being regularly encouraged through KYF2 committees, which meet regularly.
Several other areas the taskforce is currently working to address in- clude local meat processing, food hubs, and food deserts. They have also had significant success with the introduction of the People’s Garden, expansion of the USDA Farmers Market, and continue to work to get local food into federal cafeterias. While the integration of these KYF2 priorities appears a natural and common-sense ap- proach, it is in many ways an unprecedented acknowledgment of the need for bold, visionary solutions to the web of environmental factors associated with lasting local food security. As such, it repre- sents a natural opportunity for meaningful collaboration between
the Food and Nutrition Service, Agricultural Marketing Service, Rural Development, and other agencies within USDA that have a stake in farmers markets’ success and accessibility.
Let’s Move!
In February 2010, First Lady Michelle Obama introduced the Let’s Move! Campaign, which seeks to bring national awareness to the epidemic of childhood obesity and to encourage involvement from the public, nonprofit, and private sectors, as well as families to “ensure that all families have access to healthy, affordable food in their communities” (www.letsmove.gov, 2010). The four pillars of the campaign include making healthy choices, improving the nutritional quality of food in our schools, physical activity, and healthy food access. On the Campaign’s website there are several resources listed for increasing access to healthy food, one of which is ‘’increasing farmers markets, farm stands, mobile carts, and other fresh farm produce retail venues.’’ The campaign recognizes that lack of access to healthy food is a contributing factor to obesity, and farmers markets are a unique way to bring access to the community. Recommendation 4.4 of the May 2010 report, specifies: Promote the use of WIC cash value vouchers, WIC and Seniors Farmers’ Market coupons, and SNAP benefits in farmers markets and other settings where fruits and vegetables are sold
FY 2011 Healthy Food Budget Proposals
President Obama demonstrated his committment to healthy food access in his FY 2011 budget proposal. Several items were included to not only increase healthy food access, but also to revitalize local food systems. The one most relevant for this report is:
• $4 Million to equip Farmers Markets with EBT devices. As mentioned earlier in this chapter, this money would be used to provide wireless EBT point-of-sale devices to all farmers markets nationally to enable redemption of SNAP benefits.
BEYOND SNAP
SNAP benefits are not the only form of federal food assistance that farmers markets accept. The Senior Farmers Market Nutrition Pro- gram (FMNP) and the WIC FMNP inject an estimated $40 mil- lion into farmers markets annually. The WIC program has recently added fresh fruits and vegetables to its package for all 8.3 million of its participants. Benefits range from $6- $10 per month, and are made available through vouchers (Cash Value Vouchers or CVV) redeemable for any fruit or vegetable (except white potatoes). The current redemption level is being determined in Congressional FY 2011 appropriations, with an effort to increase redemption levels to Institute of Medicine (IOM) recommendations. Roughly $500-600 million annually will be disbursed for fruit and vegetable purchase through this program. At the national level, USDA has allowed
REAL FOOD, REAL CHOICE
farmers markets as eligible vendors, but ultimately the decision to include farmers markets as vendors in this program is up to each state. As of late 2009, only 21 states have decided to allow farmers markets to be eligible vendors (Fisher and Tessman, 2009).
The new WIC CVV program will present important opportuni- ties and challenging barriers for farmers markets. The FMNP has subsidized the creation and operation of numerous new markets in underserved communities, especially in New York City. The amount of funding available through the CVVs dwarfs the $20 million of the FMNP. If 10% of all CVV funds were spent in farm- ers markets, it would result in an extra $50-$60 million of income for markets, primarily in underserved communities. This amount could play an important role in fostering the development of new farmers markets in low income communities, just as the FMNP did during the 1990s and 2000s, with a much lower sum. This repre- sents slightly less than 5% of total farmers market sales nationally; USDA estimates that total sales for farmers markets in the country is approximately $1.3 billion (D. Tropp, personal communication, April 28, 2010).
However, as with EBT, the redemption process for CVVs is tai- lored toward the capacities and needs of the retail sector. Unlike, the FMNP coupons, CVV coupons are not farmer-friendly. For ex- ample, farmers must verify ID and have the user sign the vouchers, which must be used and deposited within a certain time frame, or the farmer faces a returned check fee. Farmers must have a written agreement with the state and attend special trainings.
The plethora of coupons and tokens that farmers markets accept can be quite confusing to farmers. FMNP allows for white potatoes and herbs. WIC does not. SNAP allows for the purchase of eggs, and both SNAP and Senior FMNP allow honey. WIC FMNP and CVV allow neither. Patrons using credit card and debit card tokens or scrip can receive change. SNAP, FMNP and WIC coupon users cannot receive change. The redemption processes are different. Fur- ther confusing this situation is the fact that Congress is mandating that all WIC programs go to an electronic benefits transfer system by 2020, which may mean that the FMNP and Senior FMNP will need to go electronic as well. This move will only hasten the need
41
for farmers and/or farmers markets to be able to take EBT. If these changes do happen, farmers markets will need additional types of tokens to track all the different federal funding sources, especially since the eligible products are not the same across all programs. One method of simplifying this future maze of tokens is to create the point-of-sale devices and software to allow WIC, FMNP, and SNAP to be loaded on one debit card. Additional education and technical assistance will also be needed to help farmers and markets make this transition.
At the administrative level, there exists the need for increased coor- dination among the diverse nutrition programs that interact with farmers markets to develop a unified approach, rather than a patch- work of diverse regulations. While farmer-friendly programs such as the FMNP are desirable as models, some advocates are concerned that the insertion of the WIC program into farmers markets with its outsized budget may pose problems for the future viability of the FMNP (Fisher and Tessman,2009)
BEYOND USDA
Other government agencies are beginning to become involved with farmers markets as a means of providing access to healthy foods. For example, the Environmental Protection Agency’s Brownfields program is examining food system uses, including urban agricul- ture and farmers markets, for the re-use of former industrial sites (Personal Communication, Ann Carroll, April 1, 2010). The Cen- ter for Disease Control (CDC) is involved in a project to evaluate the impact of EBT programs at farmers markets on dietary intake in conjunction with the Farmers Market Coalition. CDC and the Department of Health and Human Services have also funded a number of states, cities and tribal authorities to undertake EBT projects at farmers markets through the use of stimulus funding (ARRA). Finally, the proposed Healthy Food Financing Initiative, as proposed by the President, would create a suite of programs to bolster access to healthy foods in underserved communities. These programs include tax credits, loans and loan guarantees , and dem- onstration projects administered by Treasury, USDA, and DHHS. Farmers markets serving low income clients would be eligible for funding under this proposed program.
CONNECTING SNAP RECIPIENTS WITH FARMERS MARKETS
42
CHAPTER VII.
Road Map for Change
Throughout this project, the research team has gained insight into the various weak links between federal, state, and local SNAP pro- grams and policies for farmers and farmers markets. According to the report findings, most farmers market organizations and farmers want to participate in SNAP programs. For a variety of reasons, many of these willing partners are stymied because of barriers at the national, state, and local levels. The missing pieces include a lack of:
- Access to technical assistance
- Staffing capacity of individual farmers markets
- State level leadership within agencies, policy-making bodies, and advocacy groups
- Interagency collaboration at federal and state levels
- Innovativefundingmechanismstocovertechnologyandoper- ating costs
- Activeinvolvementfromtheprivate,philanthropic,andNGO community
- Robust and consistent evaluation that measures health im- pacts, social capital, and other non-monetary indicatorsGiven the complexity of the barriers described in Chapters III and IV of this report, it should come as no surprise that there is no sin- gle solution to nationwide SNAP success in farmers markets. As we have seen, there are a variety of models being implemented at both the local and state levels, and the authors do not recommend any one of these models as a sole prescription for widespread success. If these recommendations have one theme, it is the prioritization of innovative private-public and inter-agency partnerships.We believe that a multi-faceted approach is necessary to substantial- ly increasing the patronage of farmers markets by SNAP shoppers. Such an approach must address barriers at the consumer, market, and policy levels. Improvements in equipment and reductions in operational costs (e.g., cell phone charges) have largely eliminated the previous technological issues that plagued EBT at farmers mar- kets. There is little doubt that over time the technology will con- tinue to improve in terms of convenience, cost, and ease of use.
We have separated our recommendations into two categories. In the initial category, we have linked overarching first tier recommen- dations to specific key findings of the report. Following that section are secondary recommendations grouped by topic with suggestions for the roles various entities can play. Following is a description of the overarching findings and primary recommendations of this report.
OVERARCHING FINDINGS AND RECOMMENDATIONS
Finding # 1: Farmers markets have modest and uneven staffing and financial capacity to handle the time-consuming and potentially costly requirements of being SNAP vendors. EBT terminals can be expensive. Managing alternative currency programs can be labor- intensive. As we saw in Chapter II, markets-types vary and markets operating in underserved communities are often those with the most limited staffing capacity. Many markets just can’t handle the extra burden required of them in this area. While technology issues alone are no longer substantial barriers, many farmers markets do not have the community-level partnerships or funding mechanisms in place to cover staffing, recordkeeping, bookkeeping, and process- ing costs associated with SNAP. In addition, many underestimate the need for the significant promotion and outreach required to educate SNAP shoppers that farmers markets are able and willing to serve them.
Recommendation 1.1: Support leadership development within the farmers market community by facilitating the growth and capacity of state and regional farmers market organizations. State associations are a vital force for professionalizing the farmers market community and provide the added benefit of unifying disparate voices in state and federal policy. They can also provide on-site technical assis- tance on market management issues; facilitate peer networking for market practitioners, such as through trainings, listserves, and we- binars; and leverage resources for pilot programs. This leadership development can be done through the Farmers Market Coalition and in tandem with USDA Agricultural Marketing Service and the Farmers Market Promotion Program.
Recommendation 1.2: Farmers markets should not bear the entire cost of operating EBT. This cost should be subsidized by USDA, public agencies, and foundations. In California and Iowa, state SNAP agen- cies cover the variable and fixed costs associated with EBT transactions. This practice should be replicated in other states. Farmers markets provide numerous community and economic development benefits to communities and the regions surrounding them. They also can increase access to healthy foods in communities underserved by re- tail grocers. These markets provide crucial services for which local jurisdictions and philanthropists often pay, e.g., city governments will offer tax breaks for supermarkets to site a new store. Markets are providing a public service, and should be compensated or in-
REAL FOOD, REAL CHOICE
centivized for doing so.
Finding # 2: Successful EBT models have been developed that can overcome many challenges if the shoppers, farmers, and mar- ket managers can accommodate some measure of inconvenience. These models need to be tailored to the capacities and needs of each market. Also, market managers need better information to make decisions about the appropriate approach.
Recommendation 2.1: Launch a nationwide technical assistance program that provides train-the-trainer, mentorship, and teaching op- portunities for farmers market practitioner leaders to disseminate best practices in a peer-to-peer format. More needs to be done to support the work of market managers to successfully implement EBT pro- grams. An organized effort to share lessons learned among farmers markets will help to speed the adoption of practices and technolo- gies in this area. This technical assistance can and should take many forms including print and video resources; skill building workshops at conferences; one-on-one assistance and mentorships; “learning community” conference calls; and free-standing workshops. FNS Field Representatives, state SNAP agencies, and farmers market representatives could also hold training workshops to foster a better understanding of farmers market characteristics, needs, and recom- mended SNAP strategies for various market typologies.
Funding should come from the FNS and AMS discretionary funds, and public health and food systems funders. FNS should dedicate at least 15% of the proposed $4 million in FY 2011 for EBT to technical assistance provided by a network of experienced farmers market practitioners, social services personnel, and EBT merchant service representatives, and others. Because farmers market capacity is primary to successful EBT adoption, AMS could also develop a competitive technical assistance grant program within the FMPP.
Finding # 3: Many SNAP shoppers are not aware of the existence of farmers markets, or that they take EBT cards. When they are aware, there still exist numerous other barriers for SNAP partici- pants to shop at farmers markets, including cultural or language obstacles, inconvenient hours, product mix, transportation, and the perception that their prices are higher than in supermarkets. SNAP participants need better information about farmers markets, their prices and hours, and reasons why they should shop there.
Recommendation 3.1: Encourage farmers markets to evolve and ex- periment with new models that can help address the convenience, prod- uct, and cultural issues identified in Chapter III. Farmers markets must evolve to meet the needs of SNAP users. Just as a supermar- ket chain cannot develop a suburban-oriented store into a diverse inner-city neighborhood and expect it to be profitable, farmers markets serving low-income consumers may need to modify their models. Location along public transit lines, additional market days,
43
vouchers for health screenings, more attention to cultural com- petency, and links to community institutions are potential ways markets can evolve. An innovation fund, supported by regional HEAL Convergences among other philanthropists, could help to seed these efforts.
Recommendation 3.2: Increase support for education and outreach efforts for SNAP shoppers to patronize farmers markets with fund- ing from public health and foundation coffers. Community partners who work with low-income individuals and families have an im- portant educational role to connect SNAP shoppers with healthy food choices at farmers markets and educate farmers markets and farmers about the barriers SNAP participants face to shop at farm- ers markets. These partners include food banks and other anti- hunger and social service agencies. For example, gaining the active support of church wellness efforts for local farmers markets can be critical. If federal SNAP-Education regulations change to allow for public health approaches, these funds should be used by states to educate SNAP participants about fresh fruits and vegetables available at farmers markets. Eligible farmers market organizations in low-income communities may also apply to serve as SNAP-Ed partners.
Finding #4: Incentive programs such as the Farmers Market Nu- trition Program (FMNP) and the Senior FMNP have been critical to the success of operating markets in low-income communities. More recently, bonus programs, such as those funded by Whole- some Wave Foundation, in collaboration with the FMPP, have shown great promise in effectively drawing SNAP shoppers to farmers markets. For example, some markets have shown 300% to 900% increase in SNAP redemption, with a 50% increase once the incentives are halted (Gus Schumacher, personal communica- tion May 20, 2010).
Recommendation 4.1: Explore the creation of various programs to entice SNAP shoppers to farmers markets as part of the 2012 Farm Bill. Given public health concerns about chronic disease and obe- sity, it is most likely that these incentives would be oriented toward fruit and vegetable consumption (although this approach might face opposition from the anti-hunger lobby). Three basic models have been put forth by advocates to date:
• Following the lead of the WIC and Senior FMNP, a SNAP Farmers Market Nutrition Program. Starting with a pilot project, this program could give SNAP shoppers an extra dol- lar amount ($20-$40 per year) to use exclusively at farmers markets. This program could have a more than $1 billion price tag if implemented across the nation at these benefit rates.
• Following the model of the Healthy Incentives Pilot Pro-
CONNECTING SNAP RECIPIENTS WITH FARMERS MARKETS
44
gram and the Wholesome Wave Foundation’s work, a bonus ben efit to SNAP participants when using their benefits at farm- ers markets. The Community Health Partnership of Oregon is researching how consumers react to specific incentives in this context (i.e., how much of an incentive – 20%, 50%, 100% – is needed to get them to transform their purchases of healthy foods).
• A dedicated allocation of Specialty Crop Block Grants to the states for the specific use of promoting SNAP usage for pur- chase of eligible specialty crops at farmers markets. This ap- proach would be smaller than the other options but would be in a different title than other nutrition programs.
The foundation community should fund research into these op- tions with regards to their potential effectiveness and political fea- sibility.
Finding # 5: Nationally, there is an historic opportunity to con- nect nutrition policy and agriculture policy, especially with regards to farmers markets and local food systems through legislative and program changes in Congress and USDA. The Know Your Farmer, Know Your Food Initiative and the First Lady’s Let’s Move! Campaign are at the forefront of this opportunity. Similarly, within Food and Nutrition Service and within Agricultural Marketing Service, there are numerous programmatic changes that should happen to en- hance coordination and remove barriers.
Recommendation 5.1: USDA should continue and expand the Know Your Farmer, Know Your Food Initiative with the goal of continu- ing and expanding inter-agency collaboration between USDA programs and between state agencies to support common goals of farm viability and fresh food access for SNAP participants. USDA should develop strategies for coordinating nutrition programs that allow purchases at farmers markets, with the goal of simplifying regulations and paperwork. A single Food and Nutrition Service EBT card for SNAP, WIC/Senior FMNP, and WIC Cash Value Vouchers is one possibility, with an implementation targeted by 2020 at the latest. USDA would need to allocate sufficient resources to equip markets with the necessary upgraded machines, software, and training to adopt this one card system.
Recommendation 5.2: USDA should implement SNAP-Education according to the report language in the 2008 Farm Bill. This report language directed the Department to implement public health ap- proaches to nutrition education, which if implemented would pro- vide substantial funding for community-based organizations to un- dertake programs to support farmers markets for SNAP shoppers and other low-income consumers. There is over $300 million spent each year in this program. Once this change is made, state agencies should also fund innovative programs to connect SNAP shoppers
with farmers markets in their communities.
Recommendation 5.3: USDA should create a National Farmers Mar- ket Federal Nutrition Assistance Program Advisory Council to include relevant national stakeholders connected to the farmers market and food security community, including the Farmers Market Coalition, Community Food Security Coalition, Wholesome Wave, Project for Public Spaces, USDA Food and Nutrition Service, USDA Ag- ricultural Marketing Service, and representatives from the EBT merchant services industry. This council, to include the Farmers Market Consortium as well as public health and anti-hunger stake- holders, will provide direction for long-term sustainable strategies to leverage partnerships, new technology, current adopted policy, and future legislative policy opportunities. Similarly, states should consider the creation of such bodies within their jurisdictions, pos- sibly in conjunction with existing food policy councils.
Finding # 6: The public health community has come to recognize that the lack of access to healthy food is a social determinant of health, and potentially aggravates health disparities for the poor and for persons of color. Farmers markets can improve access to healthy food in communities underserved by retail grocers. Seen in this light, the ability of SNAP participants to use their benefits at farmers markets is fundamentally a public health issue.
Recommendation: 6.1: The public health community in all of its various institutional formats – public agency, advocacy group, founda- tion, service provider, and university – should be at the forefront of the broader efforts to improve food access for vulnerable populations, as well as of the specific efforts to connect SNAP recipients with farm- ers markets. It can play many roles, including funder for outreach, technical assistance, program operation, and capacity building; evaluator of the effectiveness of market-based programs; and advo- cacy partner at state and federal levels.
SECOND TIER OF RECOMMENDATIONS
A. Research and Evaluation
1. Improve data collection. Through the process of research for this report, the authors discovered that there are significant data collec- tion problems in USDA. Specific recommendations include:
• USDA agencies should collaborate to define farmers markets consistently.
• Individual farm retailers should be differentiated from farmers market organizations. FNS should dramatically improve the accuracy of its data to accommodate farmers and farmers mar- kets. For example, it could create two farm direct marketing categories on the FNS permit application: 1) farmers market
REAL FOOD, REAL CHOICE
and 2) farmers and farmstands.
- FNS field offices and SNAP state agencies should cross check data to ensure that farmers and farmers market SNAP sales are properly coded. This information should be distributed annu- ally to farmers market stakeholders to verify accuracy as well.
- USDA AMS should continue to improve annual data collec- tion on farmers markets and coding accuracy in the National Farmers Market Directory.
- State farmers market associations should partner with USDA to establish standardized EBT data collection tools so state and national information is more accurate.2. Develop new indicators of success. Data collection on SNAP usage at farmers markets has generally been limited to the dollar value of sales and the number of markets accepting SNAP. USDA AMS and FNS, with input from a new National Farmers Market Fed- eral Nutrition Program Advisory Council, should establish a diverse set of SNAP success indicators beyond the number of dollars redeemed that can help farmers markets set benchmarks, evaluate success, and communicate with potential stakeholders and partners. These could include the number of repeat customers, increase in per-participant redemption, and percent of farmer sales attributed to SNAP.3. Dedicate more resources to program evaluation. This field is new, emerging, and rapidly changing. To accelerate the implemen- tation of best practices, more resources need to be put into program evaluation so that practitioners can learn from each others’ successes and failures. Specific recommendations include:
- AMS should prioritize timely, comprehensive, and consistent evaluation of FMPP project results (including those funded by the 10% EBT set-aside), as well as continue to develop mecha- nisms to effectively communicate FMPP outcomes to the broader farmers market community. This will likely require additional funds for FMPP personnel staff time.
- Farmers markets, with the support of state organizations, should institutionalize annual evaluation of programs that includes standardized data collection and distribution of data to internal, state, and community partners. This evaluation should measure trends in the number of SNAP shoppers and number of returning SNAP shoppers, and track such trends before, during, and after any kind of incentive program, where applicable.4. Research into alternatives. USDA AMS and National Institute for Food and Agriculture should provide funding to study EBT programs in micro, small, medium, and large farmers markets. They should
45
work with other government agencies to support programs that en- courage farmers to evaluate and adopt new technology, as well as to encourage research that will study the costs and benefits of adopt- ing wireless technology into a farm direct marketing business. This could include such questions as: What is the tipping point where sales volume and profit margins lead to positive revenue outcomes when compared to wireless operating costs? State agencies can also investigate and implement new technologies, e.g., smart cards and iPhone-based services.
B. Federal Programs
1. Food and Nutrition Service should continue to take a leadership role in promoting farmers markets and SNAP through:
• Setting a more realistic and robust agency-wide goal of the ad- dition of 300 SNAP-authorized farmers market retailers each fiscal year, and an increase of $1.5 million; and
• Prioritizing Healthy Incentive Pilot Program proposals, which demonstrate strong collaborations with statewide and commu- nity farmers market organizations.
2. Farmers Market Promotion Program is a flagship federal initia- tive to support farmers markets. As the program is still relatively young, the Agricultural Marketing Service is still adapting to ad- ministrative challenges. With regards to EBT-related projects, AMS should continue to allow and encourage FMPP proposals to include budgets that support existing EBT projects, not only new EBT projects, and strongly encourage applicants for new EBT projects to budget for adequate staffing and bookkeeping resources as well as technical as- sistance.
CONGRESS CAN SUPPORT SNAP IN FARMERS MARKETS BY:
- Appropriating the proposed $4 million provision in the FY 2011 budget for equipping farmers markets with wireless point-of-sale devices. These allocated dollars could allow state SNAP admin- istrators to provide free wireless machines and pay for EBT transaction and monthly fees. At least 15% of this amount should be allocated to on-site and remote technical assistance provided by a network of experienced farmers market practi- tioners.
- Amending FMPP legislation to require program staff or qualified partners to provide technical assistance and to use 10% of the total funding to cover associated administrative costs. In ad- dition, allocate a portion of the FMPP funding for adminis- trative costs to implement the increase number of awarded FMPP grants.
CONNECTING SNAP RECIPIENTS WITH FARMERS MARKETS
46
• Increasing mandatory spending on the Farmers Market Promo- tion Program to $20 million per year, including 10% desig- nated specifically to providing technical assistance and techni- cal assistance capacity building to ensure awardees have the capacity to implement successful programs that bring long- term benefits to their local economies.
C. Coordination and Partnership at the State and Local Levels
1. As we seen in Chapters II-IV, the use of SNAP benefits at farmers markets involves a wide range of stakeholders in the public and pri- vate sectors, from the federal to the local levels, each with their own expertise and authority. Coordination and communication among them is paramount to any successful campaign in this area. Specific recommendations include:
- StateSNAPagenciesshouldcommunicatewithstateWICandSe- nior Farmers Market Nutrition Program staff to gain insight into how these agencies conduct outreach to their clients about farmers markets, and to develop joint outreach and education- al efforts when possible.
- Using State Exchange Funds, state SNAP agencies should col- laborate with other states to host regional conferences that would allow SNAP personnel from several states to learn from others in an interactive atmosphere.
- State SNAP agencies and state departments of agriculture should develop Memorandums of Understandings that clearly outline ways in which they can partner to increase SNAP participants’ patronage of farmers markets.
- State SNAP agencies and state departments of agriculture should establish Farmers Market SNAP grant programs, modeled af- ter the Massachusetts 2010 Grant Program (see Chapter V).
- State SNAP agencies and state departments of agriculture should collaborate with nonprofit state farmers market associations to pro- vide training, networking, and SNAP/EBT resources to farm- ers markets. These entities should also work together to stream- line waiver and permit approvals, incorporate new EBT farm- ers markets into statewide promotional campaigns, and annu- ally review data collected from EBT farmers markets and farmers.
- States should consider passing legislation that support collabora- tive, private partnership projects that build long-term relationships between local farmers markets, local DHS offices, statewide farm- ers market associations, state SNAP agencies, public health de partments, departments of agriculture and other community partners that support SNAP shoppers and farmers markets. Ex-
ample projects are Washington Farmers Market Technology Improvement Pilot Program and the California Healthy Eat- ing Consortium.
• State agencies should partner with farmers market associations where appropriate to leverage agency relationships with EBT data management contractors (such as JP Morgan and ACS) to purchase or rent wireless machines at volume prices and provide customer service for software management.
• At the local level, farmers markets should join and actively par- ticipate in statewide farmers markets associations to engage with peers and to learn from other successful models in their re- gion. They should also participate in local food system net works to leverage limited resources for promotion, pursue joint funding opportunities, and share staffing.
D. Market Innovation
1. With the plethora of EBT options available to farmers markets, individual markets and their farmer vendors should assess which system is best for them. This will require some analysis, and upon implementation, training of the vendors. Markets may also want to consider a more diverse set of funding mechanisms to ensure sustainability. Specific recommendations are as follows:
• Markets and market associations should educate farmers on the benefits and costs of implementing EBT. Engage them as equal partners in developing, implementing, and evaluating the programs.
• Farmers markets should evaluate their options when deciding which type of EBT operation to implement, in terms of cus- tomer demand, fixed and operating costs, and sustainability. In particular, markets may want to consider having all vendors operate their own wireless terminal for debit, credit, and SNAP cards, or acquiring a free state-owned SNAP-only machine, with a separate market-owned ATM machine to help cover operating costs.
• Markets should have access to and analyze zip-code level SNAP participation data, including demographic redemption trends, to help them evaluate SNAP feasibility and to plan targeted outreach campaigns.
• Some markets, especially those organized as nonprofits, should consider developing mixed revenue strategies to cover the op- erating technology, training, staffing, bookkeeping, promo- tion, and evaluation costs. Multiple funding streams include sponsorships, debit/credit convenience fees, charging vendors a small percentage of debit/credit card sales, fundraising
REAL FOOD, REAL CHOICE
events, and grants. State departments of agriculture can help markets develop such mixed revenue streams in part through educating statewide farmers market associations, individual farmers markets and farmers about the process and the require- ments of applying for the state administered USDA grants such as the Specialty Crop Program and the Federal-State Mar- keting Improvement Programs.
CONNECTING SNAP RECIPIENTS WITH FARMERS MARKETS
47
48
REFERENCES
A simple guide for Electronic Benefits Transfer (EBT) of food stamp benefits at California farmers markets using a central point of sale (POS) device and market scrip (Guide). (2008). Retrieved March 22, 2010, from, http://www.ecologycenter.org/ebt/pdf/SimpleGuide2008.pdf
Accepting bridge cards at Michigan farmers markets: 2010 resource binder [Pamphlet]. (2010). Michigan Farmers Market Association. Aubrey, A. (March 15, 2010). Why making healthful foods cheaper isn’t enough. National Public Radio. Retrieved April 17, 2010 from
http://www.npr.org/templates/story/story.php?storyId=124610428&sc=fb&cc=fp.
Bennett, J., Binus, J., Gaytan, M., Hopfe, A., Keaton, J., Lefler, A., & Schott, M. (2007). Documenting the Portland Farmers’ Market: A historical snapshot of sustainable agriculture (Rep.). Retrieved March 22, 2010, from http://www.sba.pdx.edu/faculty/tomg/FarmersMarket.pdf.
Black, J. (2009, May 27). A fresh break for the needy: Market vouchers aid families on assistance. Washington Post. Retrieved on March 14th, 2010 from http://www.washingtonpost.com/wpdyn/content/article/2009/05/25/AR200905202144.html.
Bridge, T. (2009, July 30). Nine DC farmers markets now take EBT [Web log post]. Retrieved March 22, 2010, from http://www.welovedc.com/2009/07/30/nine-dc-farmers-markets-now-take-ebt/.
Burros, M. (2009, February 4). Vouchers for veggies. Flavor Magazine. Retrieved March 22, 2010, from http://flavormagazinevirginia.com/vouchers-for-veggies/.
California Association of Nutrition and Activity Programs. (2009). SNAP-Ed: Doing more of what matters, A CAN-Act policy brief. Retrieved on August 24th, 2009 from http://can-act.net/files/snap-ed_doing_more_of_what_matters2.pdf.
California General Assembly. (25 January, 2010). Assembly Bill 537, Amended: Farmers’ markets electronic benefit transfers. Retrieved March 19, 2010, from
http://www.leginfo.ca.gov/pub/09-10/bill/asm/ab_0501-0550/ab_537_bill_20100125_amended_asm_v96.html.
California Health and Human Services Agency, Department of Social Services. (2008). Farmers market scrip participation agreement. Retrieved March 22, 2010, from http://www.ecologycenter.org/ebt/pdf/EBT_scrip_agreement.pdf.
Cody S., Schirm A., Sutaur E. & Castner L. (2008). Sources of variation in state-level food stamp participation rate. Mathematica Policy Research, Inc, 37. Retrieved on February 14, 2010 from http://hdl.handle.net/10113/32796.
Cole, L. (2009, July 7). Which price is right? The Oregonian. Retrieved March 22, 2010, from http://www.oregonlive.com/foodday/index.ssf/2009/07/which_price_is_right .html.
Costello, H. (2008, May). Accepting food stamp Electronic Benefit Transfer (EBT) cards at farmers’ markets and farm stands: A primer for farmers and market managers (Guide). Retrieved March 22, 2010, from http://extension.unh.edu/resources/representation/Resource000816_Rep852.pdf.
C-SNAP. (2008). Coming up short: High food costs outstrip food stamp benefits. C-SNAP at Boston Medical Center and Philadelphia Grow Project.
D.C. Hunger Solutions (2007). Food stamps accepted here: Attracting low-income consumers to farmers markets. Retrieved on September 15th, 2009 from http://www.dchunger.org/pdf/foodstampsacceptedhere.pdf.
REAL FOOD, REAL CHOICE
Davies, S., and Neckerman, K.M. (2009, December 3). Researching successful strategies and barriers for farmers markets to serve low- income communities (poster presentation). Project for Public Spaces. New York, New York.
DeParle, J. (2010, January 26). Americans struggle to afford food, survey finds. New York Times. Retrieved March 19, 2010, from http://www.nytimes.com/2010/01/26/us/26food.html
Doyle, M. (2007). Food stamps and farmers, it’s a win-win: Farmers toolkit for accepting electronic food stamps. Retrieved March 22, 2010, from
http://farmersmarketcoalition.org/resources//index2.php?option=com_resource&task=download&no_html=1&file=1731.
Electronic Benefits Transfer (EBT) Debit Cards. (n.d.). Retrieved March 22, 2010, from http://nofavt.org/market-organic-food/farmers-markets/ebt.
Food Research and Action Center. (2010). Food hardship: A closer look at hunger (Rep.). (2010, January). Retrieved March 22, 2010, from http://www.frac.org/pdf/food_hardship_report_2010.pdf.
Food Research and Action Center. (2009 March). FRAC Analysis: Nutrition programs and refundable tax credits in President Obama’s FY 2011 Budget. Retrieved on March 10th, 2010 from: http://www.frac.org/Legislative/budget_FY2011.htm.
Food Research and Action Center. (2009). SNAP access in urban America: A city-by-city snapshot. Retrieved on March 10th, 2010 from http://frac.org/pdf/urbanfoodstamps09.pdf.
Gosselin, M. (2010, February). Beyond the USDA: How other government agencies can support a healthier, more sustainable food system (Rep.). Retrieved March 22, 2010, from Institute for Agriculture and Trade Policy website: www.iatp.org/iatp/publications.cfm?refid=107172
Government Accountability Office. (2008 July). Food Stamp Program-Options for delivering financial incentives. Retrieved on March 15th, 2010 from http://www.gao.gov/new.items/d08415.pdf.
Grace, C., Grace, T., Becker, N., & Lyden, J. (2005, October). Barriers to using urban farmers’ market: An investigation of food stamp clients’ perception (Rep.). Retrieved March 22, 2010, from http://www.oregonfarmersmarkets.org/EBT/docs/BarrierstoUsingFarmersMarkets102206.pdf.
Greenfield, J. (2009). Leveraging partnerships to fund SNAP outreach. FNS. Retrieved on March 10th, 2010 from http://www.fns.usda.gov/FSP/outreach/pdfs/leveraging-partnerships.pdf.
Hamilton, N. D. (2005, October 26). Farmers market policy: An inventory of federal, state, and local examples (Rep.). Retrieved March 22, 2010, from http://www.pps.org/pdf/FarmersMarketPolicyPaperFINAL.pdf.
Harvie, J., Mikkelsen, L., & Shak, L. (2009). A new health care prevention agenda: Sustainable food procurement and agricultural policy. Journal of Hunger & Environmental Nutrition, 4(3), 409-429.
Hanson, K. E. Golan, G. (2002, August). Effects of changes in food stamp expenditures across the U.S. economy. USDA/ERS. Illinois, 96th General Assembly. (2009). HB3990: Local Food, Farms, and Jobs Act. Retrieved March 22, 2010, from
http://www.foodfarmsjobs.org/
Illinois, 96th General Assembly. (2010). HB 4756: The Farmers Market Technology Improvement Program Act. Retrieved March 22, 2010, from http://www.ilga.gov/legislation/BillStatus.asp?DocNum=4756&GAID=10&DocTypeID=HB&LegId=49080&Sessi onID=76&GA=96
CONNECTING SNAP RECIPIENTS WITH FARMERS MARKETS
49
50
International Rescue Committee (IRC). (2009 October). The City Heights Farmers Market: Addressing food security in San Diego. Iowa Department of Health Services. (2010, January). EBT wireless project. Retrieved March 19, 2010, from http://www.dhs.iowa.gov/docs/January10.pdf
Kim, G. (2010 February). Boston bounty bucks: Increasing access to and affordability of fresh fruits and vegetables for SNAP partici- pants. The Food Project.
Kinney, K., & Hurt, J. (2007, March). How to set up an electronic food stamp redemption program at your farmers market without using electricity or phone lines (Guide). Retrieved March 22, 2010, from http://www.farmersmarketcoalition.org/wp-content/uploads/2008/03/seattleebtsetup_2007.pdf.
Landers, P. (2007). The food stamp program: History, nutrition education, and impact. Journal of the American Dietetic Association. 107: 1945-1951.
Lewis, J., & May, R. (2009). Electronic Benefit Transfer (EBT) in farmers’ markets (Rep.). Retrieved March 22, 2010, from http://www.kyagr.com/marketing/farmmarket/documents/electronicbenefittransferinfarmersmarkets.pdf.
Marketumbrella.org. (2010). Market incentive programs: Crescent City Farmers Market’s Market Match. Marketshare Program.
Massachusetts Office of Health and Human Services. (2009, September 16). Patrick-Murray administration announces program to promote the use of SNAP benefits at farmers’ markets. Retrieved March 19, 2010, from http://www.mass.gov/?pageID=eohhs2pressrelease&L=1&L0=Home&sid=Eeohhs2&b=pressrelease&f=090916_snap_ benefits&csid=Eeohhs2
McEwen, B. (2009, August 2). Farmers markets work to draw people on a budget. The Oregonian. Retrieved March 22, 2010, from http://www.oregonlive.com/news/index.ssf/2009/08/farmers_markets_work_to_draw_p_1.html.
Megill, L. (2008, May 22). Bridging the digital divide: How to bring wireless EBT to your farmers market (Rep.). Retrieved March 22, 2010, from http://www.marketumbrella.org/uploads/file/ebt_how_to_manual.pdf.
Missouri EBT poster [Poster of the Missouri Department of Agriculture’s farmers market EBT program]. (2008). Retrieved March 22, 2010, from http://www.farmersmarketcoalition.org/wp-content/uploads/rlib/Missouri%20Small%20EBT%20Poster.jpg.
New Mexico Farmers’ Markets: Market Managers/EBT. (n.d.). Retrieved March 22, 2010, from http://farmersmarketsnm.org/Market_Managers/EBT/index.html.
New York City Greenmarket. (2007). EBT/food stamps at Greenmarket [2007 project highlight PowerPoint presentation]. Retrieved March 22, 2010, from http://data.memberclicks.com/site/famc/ebtgreenmarketpres.pdf.
Nichols, E. (2008). Webb City Farmers Market EBT vendor guide sheets (Guide). Retrieved March 22, 2010, from http://www.farmersmarketcoalition.org/resources/home/article/resource-library/2-vouchers-ebt-credit-cards/163-webb-city- farmers-market-vendor-guide-sheets-on-ebt-use.
Nischan, M. & Schumacher, A. (2010). Nourishing Neighborhoods (PowerPoint Presentation). Wholesome Wave Charitable Ventures: Westport, Connecticut.
Northeast Organic Farming Association of Vermont. (2008). EBT vendor sign: Understanding market tokens. Retrieved March 22, 2010, from http://www.nofavt.org/assets/pdf/EBT%20Vendor%20Sign.pdf.
Ohio Department of Job and Family Services, EBT Section. (2008). Ohio EBT farmers market demonstration program enrollment packet. Retrieved March 22, 2010, from http://jfs.ohio.gov/ofam/pdf/EnrollEBTFarmersMkt.pdf.
REAL FOOD, REAL CHOICE
51
Pirog, R., and McCann, N. (2009). Is local food more expensive: A consumer price perspective on local and non-local foods purchased in Iowa. Leopold Center for Sustainable Agriculture. Retrieved on March 10th, 2010 from http://www.leopold.iastate.edu/pubs/staff/prices.html.
Program boosts food stamps at King Farmers Market. (2009, September 6). The Skanner. Retrieved March 22, 2010, from http://www.theskanner.com/index.php/article/view/id/9586.
Promoting nutrition to food stamp recipients at California farmers’ markets (Guide). (2007, September). Retrieved March 22, 2010, from http://www.ecologycenter.org/ebt/pdf/promo_module.pdf.
Ragland, E., & Tropp, D. (2009). National farmers market manager survey 2006 (United States Department of Agriculture, Agricultural Marketing Service). Retrieved March 19, 2010, from http://www.ams.usda.gov/AMSv1.0/getfile?dDocName=STELPRDC5077203&acct=wdmgeninfo.
Roots of Change. (2010). California Farmers Market Consortium received grant to increase access to healthy food. Retrieved April 24, 2010, from http://www.rocfund.org/campaign/campaign/california-farmers-market-consortium-receives-grant-to-increase-ac- cess-to-healthy-food.
Ryan, A. (2009, June 25). Vouchers double value of food stamps at Boston farmers’ markets. The Boston Globe. Retrieved March 22, 2010, from http://www.boston.com/news/local/breaking_news/2009/06/vouchers_double.html.
Schumacher, A., Briggs, S., & Krumbhaar, G. (2009, May 29). Wireless card services: Supporting SNAP (food stamp), WIC and Senior Farmers Market Nutrition Programs (Rep.). Retrieved March 22, 2010, from http://www.oregonfarmersmarkets.org/cust/BarrierstoUsingFarmersMarkets2-01-08.pdf.
Solomon, N. (2009, August 26). CSA aims for affordability. Mother Nature Network. Retrieved March 22, 2010, from http://www.mnn.com/food/organic-farming/stories/csa-aims-for-affordability.
Stansfield, C. M. (1984, October). States share ideas and expertise – food stamp program. Food and Nutrition). Retrieved March 19, 2010, from http://findarticles.com/p/articles/mi_m1098/is_v14/ai_3451797/.
Stephenson, G. (2008). Farmers’ markets: Success, failure, and management ecology. Amherst, NY: Cambria.
Stephenson, G., Lev, L., & Brewer, L. (2006). Enhancing the success of Northwest farmers’ markets: An executive summary (Oregon Small Farm Technical Report Number 22, Rep.). Retrieved March 22, 2010, from http://smallfarms.oregonstate.edu/sites/default/files/TechReport22.pdf.
Stephenson, G., Lev, L., & Brewer, L. (2007). Understanding the link between farmers’ market size and management organization (Special Report 1082-E, Rep.). Retrieved March 22, 2010, from http://extension.oregonstate.edu/catalog/pdf/sr/sr1082-e.pdf.
Tropp, D., & Barham, J. (2008). National Farmers Market Summit Proceedings Report United States Department of Agriculture, Agricultural Marketing Service. Retrieved March 22, 2010, from http://www.ams.usda.gov/AMSv1.0/getfile?dDocName=STELP RDC5066926.
United States Department of Agriculture, Agricultural Marketing Service. (2009, October 5). Farmers market growth: 1994-2009. Retrieved March 22, 2010, from http://www.ams.usda.gov/AMSv1.0/ams.fetchTemplateData.do?template=TemplateS&navID= WholesaleandFarmersMarkets&leftNav=WholesaleandFarmersMarkets&page=WFMFarmersMarketGrowth&descriptin =Farmers%20Market%20Growth&acct=frmrdirmkt.
United States Department of Agriculture, Economic Research Service. (2009). Food CPI and expenditures. Retrieved May 3, 2010 from http://www.ers.usda.gov/Briefing/CPIFoodAndExpenditures/Data/Expenditures_tables/table2.htm.
CONNECTING SNAP RECIPIENTS WITH FARMERS MARKETS
52
United States Department of Agriculture, Economic Research Service. (2009, June 26). Local food systems: Emerging research and policy issues (Webcast). Retrieved May 5, 2010 from http://www.ers.usda.gov/ConferenceCenter/LocalFoods/.
United States Department of Agriculture, Food and Nutrition Service. (2006). A compilation of regulations pertaining to retail food stores, wholesale food concerns and financial institutions. Retrieved March 20, 2010, from http://www.fns.usda.gov/fsp/rules/Regulations/pdfs/110106.pdf.
United States Department of Agriculture, Food and Nutrition Service, Food Stamp Program. (2008). Food stamp nutrition education plan guidance. Retrieved on March 10th, 2010 from http://www.nal.usda.gov/foodstamp/guidance08/Final_2008_ Guidance.pdf.
United States Department of Agriculture, Food and Nutrition Service. (2009). Request for application: Supplemental Nutrition Assis- tance Program (SNAP) Healthy Incentives Pilot. Retrieved March 20, 2010, from http://www.fns.usda.gov/snap/hip/docs/ rfa.pdf.
United States Department of Agriculture Food and Nutrition Service Supplemental Nutrition Assistance Program. (2009 June). Supple mental Nutrition Assistance Program (SNAP) state outreach plan guidance. Retrieved on March 10th, 2010 from http://www.fns.usda.gov/FSP/outreach/guidance/Outreach_Plan_Guidance.pdf.
United StatesDepartment of Agriculture, Food and Nutrition Service. (2009 November). Outreach grants. Retrieved on March 15th, 2010 from http://www.fns.usda.gov/FSP/outreach/grants.htm.
United StatesDepartment of Agriculture, Food and Nutrition Service. (2009). WIC farmers market state agencies. Retrieved March 22, 2010, from http://www.fns.usda.gov/wic/Contacts/farm.htm.
United States Department of Agriculture, Food and Nutrition Service. (2009). Senior Farmers Market Nutrition Program. Retrieved March 22, 2010, from http://www.fns.usda.gov/wic/SeniorFMNP/SFMNPmenu.htm.
United States Department of Agriculture, Food and Nutrition Service. (2009). WIC Farmers Market Nutrition Program. Retrieved March 22, 2010, from http://www.fns.usda.gov/wic/FMNP/FMNPfaqs.htm.
United States Department of Agriculture, Food and Nutrition Service. (2010). History of the Food Stamp Program (FSP) to the Supplemental Nutrition Assistance Program (SNAP). Retrieved March 19, 2010, from http://www.fns.usda.gov/cga/PressReleases/2010/0028-a.pdf.
United States Department of Agriculture, Food and Nutrition Service. (2010). Program access toolkit: A guide for state agencies on improving access to the Supplemental Nutrition Assistance Program. Retrieved March 19, 2010, from http://www.fns.usda.gov/fsp/government/pdf/2010-toolkit.pdf.
United States, Department of Agriculture, Food and Nutrition Service. (2010). Supplemental Nutrition Assistance Program: Get EBT equipment. Retrieved March 19, 2010, from http://www.fns.usda.gov/snap/ebt/fm-scrip-EBT_Equipment.htm.
United States, Department of Agriculture, Food and Nutrition Service. (2010, May 19). USDA unveils new consumer information resources about SNAP for people in need of food assistance (Release No. 0272.10). Retrieved May 27, 2010 from http://www.fns.usda.gov/cga/PressReleases/2010/0272.htm
United States, Department of Agriculture, Food and Nutrition Service, Detroit Field Office. (n.d.). Frequently asked questions: EBT and serving food stamp customers. Retrieved March 22, 2010, from http://www.farmersmarketcoalition.org/resources/resource-li- brary/article/1-resource-library/133-frequently-asked-questions-ebtserving-food-stamp-customers.
REAL FOOD, REAL CHOICE
United States, Department of Agriculture, National Agricultural Statistics Service. (2009). 2007 Census of Agriculture: Farmers by age (fact sheet). Retrieved on May 3, 2010 from http://www.agcensus.usda.gov/Publications/2007/Online_Highlights/Fact_Sheets/farmer_age.pdf.
United States, Department of Agriculture, National Institute of Food and Agriculture. (2009). SNAP-Ed. Retrieved on March 14th, 2010 from http://www.csrees.usda.gov/nea/food/fsne/fsne.html.
Ver Ploeg, M., Breneman, V., Farrigan, T., Hamrick, K., Hopkins, D., Kaufman, P., Tuckermanty, E. (2009). Access to affordable and nutritious food-Measuring and understanding food deserts and their consequences: Report to Congress (AP-036) (United States, Department of Agriculture, Economic Research Service). Retrieved March 22, 2010, from http://www.ers.usda.gov/Publica- tions/AP/AP036/.
Wasserman, W. (2009, May). Services, structures, and self-identified needs of state farmers market associations/organizations: A survey summary report (Rep.). Retrieved March 22, 2010, from http://www.farmersmarketcoalition.org/wp-content/uploads//2009/06/final_fma_survey_report_wdata.pdf.
Winch, R. (2008, October). Nutrition incentives at farmers markets: Bringing fresh, healthy, local foods within reach (Rep.). Retrieved March 22, 2010, from http://farmersmarketcoalition.org/resources//index2.php?option=com_resource&task=download&no_ html=1&file=2458.
Zezima, K. (2009, July 19). Food stamps, now paperless, are getting easier to use at farmers markets. The New York Times. Retrieved March 22, 2010, from http://www.nytimes.com/2009/07/20/us/20market.html?_r=2.
Zuniga, T. (2007). California EBT farmers’ market scrip guidelines (California, Health and Human Services Agency, Department of Social Services). Sacramento, CA: Department of Social Services. Retrieved March 22, 2010, from http://www.ecologycenter.org/ebt/pdf/EBT_scrip_guidelines.pdf.
CONNECTING SNAP RECIPIENTS WITH FARMERS MARKETS
53
54
RESEARCH CONTACTS
CALIFORNIA
Dan Best, General Counsel, California Federation of Certified Farmers’ Markets
Edie Jessup, Fresno Metro Ministries
Penny Leff, University of California Davis (Formerly of the Berkeley Farmers’ Market) Matt Sharp, California Food Policy Advocates
John Silveira, Director, Pacific Coast Farmers Markets Association
Pompea Smith, Chief Executive Officer, Sustainable Economic Enterprises of Los Angeles (SEE-LA) Melody Steeples, California Association of Nutrition and Activity Programs
Frank Tamborello, Hunger Action Los Angeles
Deborah Yashar, Food Systems Program Manager, Agriculture and Land-Based Training Association
CONNECTICUT
Lucy Nolan, End Hunger Connecticut
DISTRICT OF COLUMBIA
Jody Tick, Capital Area Food Bank
GEORGIA
Laura Lester, Atlanta Community Food Bank
ILLINOIS
David Rand, Chicago Farm Forager and Green City Farmers Market Manager
IOWA
Ginny Gieseke, President, Iowa Farmers Market Association
Jan Walters, EBT Manager, Iowa Department of Human Services
LOUISIANA
Emery Van Hook, Director of Markets, marketumbrella.org Darlene Wolnik, Director of Marketshare, marketumbrella.org
MARYLAND
Amy Crone, Agricultural Marketing Specialist, Maryland Department of Agriculture
Kay Finegan, Director of Bureau of Policy and Training, Maryland Department of Human Resources
MICHIGAN
Dru Montri, Association Manager, Michigan Farmers Market Association
MINNESOTA
Amanda Baesler, Minnesota Department of Agriculture
Joanne Berkenkamp, Institute for Agriculture and Trade Policy
Tikki Brown, Program Administrator, Food Support Outreach and Nutrition Education, Minnesota Department of Human Services David Nicholson, Market Manager, Midtown Farmers Market Association
John Ulland, President, Minnesota Farmers Markets Association
REAL FOOD, REAL CHOICE
NEW JERSEY
Ron Good, Bureau Chief, New Jersey Department of Agriculture
Robert Hegstrom, EBT Unit Production Manager, New Jersey Department of Human Services
NEW MEXICO
Denise Miller, Executive Director, New Mexico Farmers Market Association
NEW YORK
Diane Eggert, Farmers Market Federation of New York
NORTH CAROLINA
Brook Thompson, Appalachian Sustainable Agriculture Project
OHIO
Beth Kowalczyk, Ohio Job and Family Services
OREGON
Raymond Saul, Founder of Hollywood Farmers Market
Karen Wagner, President, Oregon Farmers Market Association
Nancy Weed, Oregon Hunger Relief Task Force and Partners for a Hunger Free Oregon
PENNSYLVANIA
Megan Cook, former director of Farmers Market Alliance of Western Pennsylvania Jon Glyn, Market Manager, The Food Trust
Duane Perry, Founder, The Food Trust
Ken Regal, Just Harvest
Donna Roe, Pennsylvania Department of Public Welfare
Sandy Sherman, Director of Nutrition Education, The Food Trust
TEXAS
Cal Brints, President, Texas Certified Farmers Market Association Kay Jones, Texas Health and Human Services Commission Andrew Smiley, Sustainable Food Center
VERMONT
Jean Hamilton, Direct Marketing and Community Food Security Coordinator, Northeast Organic Farmers Association/Vermont Farmers Market Association
WASHINGTON
Jackie Aitchison, Executive Director, Washington State Farmers Markets Association
John Camp, Administrator of Food Assistance Programs, Washington Department of Social and Health Services Rita Ordonez, Program Manager, Farmers Market Technology Improvement Program
CONNECTING SNAP RECIPIENTS WITH FARMERS MARKETS
55
56
REAL FOOD, REAL CHOICE
APPENDICES
- State by State Data of SNAP in Farmers Markets, Fiscal Year 2009 (October 2008-September 2009)
- State Farmers Market Organization Responses to Survey Questions, December 2009
- Comparison of Responsibility for SNAP-Related Costs in Selected States
STATE SYNOPSES
- California
- Iowa
- Illinois
- Lousiana
- Maryland
- Michigan
- Minnesota
- New Jersey
- New Mexico
- New York
- Oregon
- Pennsylvania
- Texas
- Vermont
- Washington
57
CONNECTING SNAP RECIPIENTS WITH FARMERS MARKETS
58
A.
STATE BY STATE DATA ON SNAP IN FARMERS MARKETS, FISCAL YEAR 2009 (OCT. 2008-SEPT. 2009) ( DATA AS OF DECEMBER 2009)
|
STATE |
TOTAL SNAP REDEMPTIONS |
AVERAGE MONTHLY SNAP PARTICIPATION |
TOTAL 2009 SNAP FARMERS MARKET REDEMPTIONS |
GROWTH IN SNAP REDEMPTIONS BETWEEN 2008 AND 2009 |
% OF TOTAL 2009 SNAP SPENDING AT FMS |
|
ALABAMA |
$ 957,738,053.33 |
679,138 |
$ 4,731.94 |
883.77% |
0.0005% |
|
ALASKA |
$ 127,864,703.38 |
64,385 |
N/A |
– |
– |
|
ARIZONA |
$ 1,195,607,746.21 |
813,987 |
$ 16,646.12 |
128.32% |
0.0014% |
|
ARKANSAS |
$ 572,944,335.99 |
411,153 |
$ 118,874.20 |
73.04% |
0.0207% |
|
CALIFORNIA |
$ 4,367,362,380.16 |
2,670,341 |
$ 929,530.38 |
96.06% |
0.0213% |
|
COLORADO |
$ 500,108,893.59 |
319,121 |
$ 49,556.26 |
45.05% |
0.0099% |
|
CONNECTICUT |
$ 412,889,661.98 |
258,165 |
$ 10,065.74 |
192.93% |
0.0024% |
|
DELAWARE |
$ 132,323,851.65 |
90,933 |
N/A |
– |
– |
|
DISTRICT OF COLUMBIA |
$ 96,643,653.92 |
103,311 |
$ 6,097.21 |
657.37% |
0.0063% |
|
FLORIDA |
$ 2,943,191,076.01 |
1,952,362 |
$ 115,214.37 |
138.35% |
0.0039% |
|
GEORGIA |
$ 1,945,090,936.64 |
1,286,078 |
$ 73,072.32 |
47.88% |
0.0038% |
|
HAWAII |
$ 270,646,141.18 |
144,599 |
$ 237,581.74 |
60.05% |
0.0878% |
|
IDAHO |
$ 198,653,188.54 |
136,243 |
$ 2,519.03 |
518.93% |
0.0013% |
|
ILLINOIS |
$ 2,278,777,164.06 |
1,462,421 |
$ 11,146.45 |
-40.77% |
0.0005% |
|
INDIANA |
$ 1,086,824,402.30 |
1,462,421 |
$ 11,006.04 |
26.88% |
0.0010% |
|
IOWA |
$ 417,141,760.59 |
295,106 |
$ 62,439.66 |
57.00% |
0.0150% |
|
KANSAS |
$ 301,647,407.33 |
219,265 |
$ 9,276.15 |
108.08% |
0.0031% |
|
KENTUCKY |
$ 1,009,084,142.14 |
701,757 |
$ 14,142.42 |
192.24% |
0.0014% |
|
LOUISIANA |
$1,195,448,832.37 |
723,738 |
N/A |
150.97% |
– |
|
MAINE |
$ 281,325,145.72 |
201,248 |
$ 5,979.31 |
518.53% |
0.0021% |
|
MARYLAND |
$ 721,665,093.35 |
454,196 |
$ 2,126.50 |
237.54% |
0.0003% |
|
MASSACHUSETTS |
$ 907,567,980.12 |
627,611 |
$ 19,066.40 |
159.99% |
0.0021% |
|
MICHIGAN |
$ 2,071,222,295.09 |
1,450,272 |
$ 280,611.52 |
104.69% |
0.0135% |
|
MINNESOTA |
$ 448,706,694.64 |
344,972 |
$ 3,458.34 |
190.37% |
0.0008% |
|
MISSISSIPPI |
$ 714,414,766.00 |
505,920 |
$ 25,634.75 |
34.10% |
0.0036% |
|
MISSOURI |
$ 1,120,943,538.42 |
1,033,249 |
$ 22,638.31 |
366.88% |
0.0020% |
|
MONTANA |
$ 131,688,820.52 |
92,453 |
$ 32,586.21 |
106.79% |
0.0247% |
|
NEBRASKA |
$ 186,081,119.19 |
133,623 |
$ 235.25 |
234.88% |
0.0001% |
|
NEVADA |
$ 291,642,593.77 |
200,056 |
N/A |
– |
– |
|
NEW HAMPSHIRE |
$ 141,047,327.17 |
78,942 |
N/A |
880.72% |
– |
|
NEW JERSEY |
$ 772,455,748.17 |
499,853 |
$ 718,121.26 |
96.88% |
0.0930% |
REAL FOOD, REAL CHOICE
59
|
STATE |
TOTAL SNAP REDEMPTIONS |
AVERAGE MONTHLY SNAP PARTICIPATION |
TOTAL 2009 SNAP FARMERS MARKET REDEMPTIONS |
GROWTH IN SNAP REDEMPTIONS BETWEEN 2008 AND 2009 |
% OF TOTAL 2009 SNAP SPENDING AT FMS |
|
NEW MEXICO |
$ 404,154,992.18 |
291,073 |
$ 12,870.97 |
168.39% |
0.0032% |
|
NEW YORK |
$ 3,854,161,404.25 |
2,322,742 |
$ 595,126.27 |
199.94% |
0.0154% |
|
NORTH CAROLINA |
$1,613,097,613.55 |
1,137,294 |
$ 16,020.62 |
303.15% |
0.0010% |
|
NORTH DAKOTA |
$ 80,862,790.47 |
53,070 |
N/A |
– |
– |
|
OHIO |
$ 2,136,086,606.67 |
1,357,412 |
$ 49,203.67 |
221.81% |
0.0023% |
|
OKLAHOMA |
$ 652,995,820.52 |
472,908 |
$ 1,460.00 |
6770.59% |
0.0002% |
|
OREGON |
$ 792,673,762.88 |
581,025 |
$ 261,229.63 |
173.46% |
0.0330% |
|
PENNSYLVANIA |
$ 1,881,837,071.32 |
1,337,803 |
$ 20,646.21 |
120.64% |
0.0011% |
|
RHODE ISLAND |
$ 163,158,695.64 |
102,303 |
$ 17,802.50 |
1016.66% |
0.0109% |
|
SOUTH CAROLINA |
$ 1,001,943,208.50 |
687,508 |
$ 77,654.78 |
265.17% |
0.0078% |
|
SOUTH DAKOTA |
$ 105,033,022.03 |
73,981 |
N/A |
– |
– |
|
TENNESSEE |
$ 1,554,593,801.71 |
1,072,055 |
$ 15,372.72 |
84.02% |
0.0010% |
|
TEXAS |
$ 4,410,042,788.49 |
3,003,156 |
$ 50,163.41 |
204.11% |
0.0011% |
|
UTAH |
$ 255,096,731.99 |
185,282 |
$ 14,121.00 |
149.18% |
0.0055% |
|
VERMONT |
$ 72,719,652.58 |
72,125 |
$ 26,157.83 |
505.23% |
0.0360% |
|
VIRGINIA |
$ 937,268,323.81 |
651,725 |
$ 13,498.39 |
411.49% |
0.0014% |
|
WASHINGTON |
$ 1,037,964,888.92 |
761,220 |
$ 142,759.43 |
199.86% |
0.0138% |
|
WEST VIRGINIA |
$ 385,105,131.62 |
305,960 |
$ 3,071.51 |
97.84% |
0.0008% |
|
WISCONSIN |
$ 669,598,949.79 |
547,878 |
$ 17,087.12 |
167.04% |
0.0026% |
|
WYOMING |
$ 37,537,277.92 |
26,762 |
N/A |
– |
– |
|
TOTAL |
$49,956,715,781 |
33,722,293 |
$4,173,323 |
97.30% |
0.00835% |
|
Based on combined data sent by Susan Modine and Carolyn Foley (state by state monthly redemptions of SNAP at FMs April-Sept 2009) and SUPPLEMENTAL NUTRITION ASSISTANCE PROGRAM: NUMBER OF PERSONS PARTICIPATING (http://www.fns.usda.gov/pd/29SNAPcurrPP.htm) |
|||||
CONNECTING SNAP RECIPIENTS WITH FARMERS MARKETS
60
REAL FOOD, REAL CHOICE
B.
STATE FARMERS MARKET ORGANIZATION RESPONSES TO SURVEY QUESTIONS, DECEMBER 2009
RESPONSES 16
MY STATE’S FARMERS MARKETS IMPLEMENT SNAP AT THE:
N/A
N/A
N/A
Farmers market level 8 Farmers level 2 Both farmers and market level 4
√ √
√
√ √ √
√ √ √
WHY DO YOU THINK FARMERS MARKETS IN YOUR STATE IMPLEMENT SNAP PROGRAMS?
To increase consumers’ access to healthful foods
To expand farmers’ income opportunities Because market patrons request EBT/ SNAP adoptions
Because local organizations encourage EBT/SNAP adoption
Other: Our Commissioner requested
the program
√ √ √
√√√ √ √√ √ √
Cumbersome FNS permit process Inadequate staffing capacity for recordkeeping
Inadequate staffing for SNAP promotion and outreach
8 √√
16 √√ √
√√ √ √ √√√√√
√ √
√ √√
√ √√√ √
Limited access to start-up funding
Lack of recordkeeping tools and information
Perception that the benefit to farmers will not justify cost
√ √√√√ 10√√√√√√√ √√√
Markets don’t know where or how to start the process
7√√√√√√√
TOTAL CA IA IL LA MD MI MN NJ NM NY OR PA TX VT WA
TOTAL CA IA IL LA MD MI MN NJ NM NY OR PA TX VT WA
√ √ 15√√√ √√√√√
14 √ √ √ 7√√
√ √ √
√√√√√√ √ 1√
√ √√ √
15√√√ √
WHAT DO YOU THINK IS IMPEDING SOME MARKETS IN YOUR STATE FROM IMPLEMENTING SNAP/EBT PROGRAMS?
√
√ √
√ √√√√ √√√√
√ √√ √ √ 9√√√√√√√√√
13 √ √ 11 √√ √
√ √√√√
√ √
√ √
61
CONNECTING SNAP RECIPIENTS WITH FARMERS MARKETS
WHAT DO YOU THINK IS IMPEDING SOME MARKETS IN YOUR STATE FROM IMPLEMENTING SNAP/EBT PROGRAMS? (CONTINUED)
Other: Too few transactions during pilot Other: Inadequate staffing capacity for on-site program management
Other: Do not want low-income shoppers coming to market
1 √ 1√
Other: Local government bureaucracy Other: Scared that it will be overwhelm- ing in general for market staff/volunteers
1√
1 √ 1√
HOW SUPPORTIVE OF SNAP IMPLEMENTATION ARE FARMERS AND MARKET MANAGERS IN YOUR STATE? **
Farmers (4 Very Supportive, 7 Somewhat Supportive, 3 Somewhat Reluctant) Market Managers (6 Very Supportive,
5 Somewhat Supportive, 2 Neutral, 2 Somewhat Reluctant)
3.86 5, 2
5 2 4 4 4 2 4 4 5, 4
4 5 4 4
4.00 5, 2
** 5 = Very Supportive, 4 = Somewhat Supportive, 3 = Neutral, 2 = Somewhat Reluctant, 1 = Very Reluctant
5 3 5 5, 2 4 3 5 5 4, 4
62
REAL FOOD, REAL CHOICE
C.
COMPARISON OF RESPONSIBILITY FOR SNAP-RELATED COSTS IN SELECTED STATES
STATE CALIFORNIA
WIRELESS MACHINE
SNAP TRANSACTION
WIRELESS MONTHLY FEES
TOKENS
SNAP PROMOTIONS
NUMBER OF SNAP MARKETS/FARMERS
ILLINOIS
Not provided by State SNAP Agency (legislation pending)
Paid by farmers markets
Paid by farmers markets
IOWA
State loans (at no cost) SNAP/Debit/Credit Card machines to farmers
Paid by SNAP agency
Paid by SNAP agency
Not required with farmer EBT Program
Some marketing depending on yearly budget
161 farmers
LOUISIANA MARYLAND MICHIGAN MINNESOTA NEW JERSEY NEW MEXICO
Not provided by state SNAP agency
Paid by farmers markets
Paid by farmers markets Paid by farmers markets Paid by farmers markets Paid by farmers markets Paid by farmers markets Paid by SNAP agency
3 farmers markets
NEW YORK
Provided by State FM As- sociation (through SNAP agency funds & grants)
Reimbursed by SNAP agency at end of season
Paid by farmers markets
Provided by state FM association
Statewide farmers mar- ket association provides banners & media kits
135 farmers markets
OREGON PENNSYLVANIA TEXAS VERMONT WASHINGTON
Not provided by state SNAP agency
Paid by farmers markets
Paid by farmers markets Paid by farmers markets Paid by farmers markets Paid by farmers markets Paid by farmers markets
Paid by farmers markets Paid by farmers markets
47 farmers markets 16 farmers markets
State provides SNAP- only machines
SNAP Agency pays fees if a market does $100/month
Paid by SNAP Agency Paid by farmers markets
51 farmers markets 9 farmers markets
Not provided by state SNAP agency
Paid by farmers markets
Paid by farmers markets Paid by farmers markets Paid by farmers markets Paid by farmers markets
3 farmers markets 29 farmers markets 7 farmers markets 25 farmers
6 farmers markets
Not provided by state SNAP agency
Paid by farmers markets
Not provided by state SNAP agency
Paid by farmers markets
Not provided by state SNAP agency
Paid by farmers markets
Provided by state SNAP agency
Paid by SNAP agency
Not provided by state SNAP agency
Paid by farmers markets
Not provided by state SNAP agency
Paid by farmers markets
Not provided by state SNAP agency
Paid by farmers markets
Provided by state FM association
FM association provides banner
16 Markets
Not provided by state SNAP agency
Reimbursed by SNAP agency
Paid by farmers markets
20 farmers markets (in pilot program)
COST
D.
STATE SYNOPSIS: CALIFORNIA
QUANTITATIVE OVERVIEW BASED ON USDA DATA
• Token use should be eliminated**
• Analysis is needed on the benefits and costs of using tokens in various size markets****
INSIGHTS ABOUT CALIFORNIA FARMERS MARKETS
- California has several regional farmers market management organizations. For example, Pacific Coast Farmers Markets Association has 60 farmers markets in northern California, and SEE-LA has seven farmers markets in Los Angeles. Orange County and San Diego County farm bureaus each manage farmers markets within their counties.
- California SNAP administration provides free SNAP-Only wireless machines, and pays both SNAP transactions and monthly fees.
- Since California currently provides free SNAP-only machines, few farmers markets or farmers currently accept debit and credit cards.
- Many farmers feel the machines are too much trouble. How- ever, farmers market managers foresee debit and credit cards expanding and fear that farmers will lose future sales if they choose not to adopt this new technology.*
- Organizations are studying the barriers perceived by the farm- ers to adopt wireless technology so farmers markets do not have to manage the SNAP programs.
- Farmers markets are building strong relationships with state and county public health departments. County public health departments are providing regional EBT farmers market bro- chures. Farmers markets also have benefited from the state- wide California Public Health Department’s program “Net- work of Healthy California.” The Network represents a state- wide movement of local, state and national partners collec- tively working toward improving the health status of low-in- come Californians through increased fruit and vegetable con- sumption and daily physical activity.LEAD CONTACTS:Dan Best, General Counsel, California Federation of Certified Farmers’ Markets *
John Silveira, Director, Pacific Coast Farmers Markets Association ** Pompea Smith, Chief Executive Officer, Sustainable Economic En- terprises of Los Angeles (SEE-LA)***
Deborah Yashar, Food Systems Program Manager, Agriculture and Land-Based Training Association ****
63
|
Number of farmers markets in state in 2009 (USDA AMS) |
547 |
|
Number of markets that accept SNAP EBT cards (USDA AMS) |
51 |
|
2008 Farmers Markets SNAP Sales (USDA FNS) |
$474,113 |
|
2009 Farmers Markets SNAP Sales (USDA FNS) |
$929,530 |
CHALLENGES AND OPPORTUNITIES FOR SNAP FARMERS MARKETS AND STATE AGENCIES
- Farmers markets lack funding to start up and manage book keeping and reporting requirements of the program **
- In some farmers markets, disregard for low-income and people of color have influenced the decisions on whether to provide SNAP in farmers markets****
- Farmers markets feel limited support/transparency from government agencies ****
- Lack of transportation options to attend farmers market is a barrier for SNAP shoppers ****
- Farmers markets are perceived as cost prohibitive for SNAP shoppers ***
- Residual monies (outstanding tokens) are a liability for farm- ers markets*
- Farmers need encouragement to adopt wireless technology which would eliminate the need for tokens *
- Work towards farmers embracing the EBT wireless technol- ogy so farmers markets do not become overwhelm with future FNS EBT programs*
- Encourage USDA FNS to simplify the federal farmers market programs*
- Benefits to farmers markets will not justify the cost **
- Streamline the USDA FNS permit process**
- Build community partnerships to expand SNAP promotion and outreach **
CONNECTING SNAP RECIPIENTS WITH FARMERS MARKETS
64
E.
STATE SYNOPSIS: IOWA
QUANTITATIVE OVERVIEW
tration office inquiring how they can sign up for the program. In five years, the program has grown from 10 farmers to 167 farmers.
With the Iowa farmer-level program, the outreach to SNAP shoppers is spearheaded by the EBT manager with the support of other state agencies, local farmers market, and their com- munity partners.
Inlargerfarmersmarkets,themarketmanagercreatesamarket map showing the location of SNAP authorized farmers. In smaller markets, state EBT provided signage is usually ade- quate to connect SNAP shoppers with their farmers.
The Iowa Farm Bureau worked with the EBT administration to jump start the program. For the first three years, the IA Farm Bureau paid for the farmers’ debit and credit card trans- actions. Today, with a decrease in funding, promotional cam- paigns focus on printed brochures listing both the EBT farm- ers and the markets where they sell. The EBT agency posts this information in each DHS county office and on the DHS website, as well as links to community partners’ websites.
The EBT project manager consistently communicates with its farmers through a monthly newsletter, which includes success stories, data, and technology updates.
|
Number of farmers markets in state in 2009 (USDA AMS) |
225 |
|
Number of markets that accept SNAP EBT cards (USDA AMS) |
167 farmers |
|
2008 Farmers Markets SNAP Sales (USDA FNS) |
$39,434 |
|
2009 Farmers Markets SNAP Sales (USDA FNS) |
$62,439 |
CHALLENGES AND OPPORTUNITIES FOR SNAP FARMERS MARKETS AND STATE AGENCIES
- Lackoftransportationoptionstothemarketinbothruraland urban communities
- State budget cuts are decreasing dollars allocated for SNAP outreach and promotion. Farmers markets need repeated mes- saging and promotions to SNAP shoppers to encourage them to consider shopping at farmers markets
- Low-income communities have a limited number of farmers markets
- SNAP shoppers perceive convenience, hours/day of the week, and price as barriers to shopping at farmers markets
- Agency views nutrition education and SNAP outreach as a way to increase access/awareness of markets as options for SNAP shoppersINSIGHTS ABOUT IOWA FARMERS MARKETS
- Prior to 2005, Iowa was using food stamp coupons. Iowa was able to keep farmers connected to the federal food stamp dol- lars by implementing wireless technology before it was well established for SNAP.
- Iowa EBT administration offers the EBT wireless program to Iowa farmers. The funding for the program is a 50/50 SNAP administration match and is now part of the on-going EBT budget. This budget pays for the machine, account activa- tion, SNAP transaction fees and related SNAP monthly fees. The machine is also programmed to accept debit and credit card transactions. The farmers are responsible for all related debit, credit card fees and PCI (Payment Card Industry) fees, if applicable.
- After five years, farmers are now contacting the EBT adminis-
•
•
•
•
REAL FOOD, REAL CHOICE
LEAD CONTACTS:
Jan Walters, EBT Manager, Iowa Department of Human Services Ginny Gieseke, President, Iowa Farmers Market Association
Future Iowa Department of Human Services direct contact for farmers markets:
Tracy Penick, EBT Manager, Iowa Department of Human Services
F.
STATE SYNOPSIS: ILLINOIS
QUANTITATIVE OVERVIEW
65
ert.” The market is run by the Experimental Station, a non- profit incubator of innovative cultural, educational, and en- vironmental projects and small-scale enterprises. In 2009, the market accepted SNAP and provided matching funds through a Wholesome Wave Foundation grant.
Thirtyyearsago,Chicagodevelopedafarmermarketprogram which has grown to 22 farmers markets. The program has resided in various departments over the years including the Department of Culture Affairs, Tourism, and currently, in the Mayor’s office of Special Events. Although the markets can ac- cess many supporting city services, a city-run farmers markets still has barriers to implementing EBT. The farmers market manager’s primary role is to manage the site during the market hours as opposed to being a community event organizer. The city does not currently manage EBT in-house due to:
o Staffing limitations
o Cost of wireless machines
o Lack of volunteers due to city labor agreements
Though community partners have run EBT programs in some cities, other cities, like Chicago, require an open Request for Proposal process. However, in the 2010 season, City of Chica go subcontracted with the Experimental Station to do a pilot EBT program at 5 farmers markets in conjunction with a Wholesome Wave Foundation grant.
TheGreenCityFarmersMarketisanindependentnon-profit, year-round farmers market in Chicago with 55 vendors. The staff chose to implement a market level SNAP-only paper re= ceipt system over the token system to minimize liability and staffing requirements. Based on the feedback from market SNAP shoppers, they do not feel stigmatized by this multi-step purchasing process. A few farmers who own wireless machines do offer debit and credit cards service.
|
Number of farmers markets in state in 2009 (USDA AMS) |
261 |
|
Number of markets that accept SNAP EBT cards (USDA AMS) |
9 |
|
2008 Farmers Markets SNAP Sales (USDA FNS) |
– |
|
2009 Farmers Markets SNAP Sales (USDA FNS) |
$11,146 |
•
CHALLENGES AND OPPORTUNITIES FOR SNAP FARMERS MARKETS AND STATE AGENCIES
- Illinoishasaninformalstatewidefarmersmarketnetworkwith no capacity to support SNAP farmers markets at this time. There are efforts underway, however, to develop an association which could train farmers markets
- CityofChicagofarmersmarketshaveuniquechallengesbeing inside a government agency.
o City does not have accounting systems that can easily ac- commodate farmers markets SNAP bookkeeping require- ments
o City budget is flexible and requires RFP process.
o Government farmers markets lack the ability to have ad- equate farmer market staffing
- Allfarmermarketsneedoutreachpromotionalstrategiestoen- courage SNAP shoppers
- The service from wireless merchant providers needs to improve
- USDA needs to streamline WIC/Seniors FMNP coupons, WIC Cash Value Voucher and SNAP by using one EBT card for all benefits distribution
- Increased advocacy is needed for State Department of Hu- man Service to provide more support in educating SNAP shoppers about farmers marketsINSIGHTS ABOUT ILLINOIS FARMERS MARKETS• The 61st Street Farmers Market in the Woodlawn/Hyde Park neighborhood is serving an area that is considered a “food des-
•
LEAD CONTACT:
David Rand, Farm Forager for the Green City Market and the City of Chicago
CONNECTING SNAP RECIPIENTS WITH FARMERS MARKETS
66
G.
STATE SYNOPSIS: LOUISIANA
QUANTITATIVE
Note: Information based on interviews with marketumbrella.org in New Orleans, which hosts the Crescent City Farmers Market, one of few market networks integrating SNAP.
CHALLENGES AND OPPORTUNITIES FOR SNAP FARMERS MARKETS AND STATE AGENCIES
- Louisiana currently has no statewide farmers markets organi- zation to provide EBT technical assistance or leverage financial support for widespread adoption
- The staff hours required to count tokens is increasing with the success of marketumbrella.org’s SNAP, debit, and credit card program
- Markets need to secure more funding to pay for the EBT program
- There is a general lack of support from governmental agencies to perform SNAP promotion and outreach
- Markets need to find proper ways and time to communicate the programINSIGHTS ABOUT LOUISIANA FARMERS MARKETS
- The Louisiana Department of Agriculture and Forestry main- tains a listing of farmers markets and roadside stands on their website.
- USDA Food & Nutrition Service redacted Louisiana SNAP sales in farmers markets from public data sets due to too few SNAP authorized sites.
- marketumbrella.orghasthreefarmersmarketsacceptingSNAP, debit and credit cards since January 2010 These three markets are under the same FNS permit. Their total 2009 SNAP sales, in two markets, totaled $17,852.
- marketumbrella.org charges a $1.00 token handling fee to
•
•
•
• •
shoppers on both debit and credit cards. This fee covers 80% of the program’s operating costs (exclusive of EBT machine and supply costs).
Vendors pay stall fees with tokens to ease cash flow issues. It also means the organization itself participates in the token system.
All of marketumbrella.org’s promotional materials highlight the SNAP program. They distribute posters at senior meal centers, WIC offices, and DHS offices, as well as purchase bus stop and radio ads.
marketumbrella.orgdoesamatchingdollarprogramupto$25 per day. Match participants are asked about how they heard about the incentive campaign and the transportation they used to reach the market.
Most SNAP shoppers learn about the matching dollar pro- gram through word of mouth during the outreach campaign.
Operating a central SNAP terminal aligns with the goal of the market organization to attract new and repeat shoppers and to benefit participating producers. SNAP is not perceived as an added burden.
|
Number of farmers markets in state in 2009 (USDA AMS) |
31 |
|
Number of markets that accept SNAP EBT cards (USDA AMS) |
3 |
|
2008 Farmers Markets SNAP Sales (USDA FNS) |
N/A |
|
2009 Farmers Markets SNAP Sales (USDA FNS) |
N/A |
REAL FOOD, REAL CHOICE
LEAD CONTACTS:
Emery Van Hook, Director of Markets, marketumbrella.org Darlene Wolnik, Director of Marketshare, marketumbrella.org
H.
STATE SYNOPSIS: MARYLAND
QUANTITATIVE OVERVIEW
•
•
•
very small, if any, stall fees.
The Maryland Department of Agriculture manages the WIC and Senior FMNP program. As Maryland does not have a statewide farmers markets association, the Maryland Depart- ment of Agriculture serves as a hub for networking for farmers and farmers markets. The nonprofit organization Future Har- vest-Chesapeake Alliance for Sustainable Agriculture (FH- CASA) also plays a role in providing professional development for farmers market managers.
Many farmers are skeptical of federal programs which require additional steps beyond simply collecting cash from customers at market.
In 2009, Maryland Hunger Solution secured a grant to imple- ment SNAP in two Baltimore Farmers Markets during the 2010 season. With additional funding from Wholesome Wave, the program was able to add a third farmers market.
67
|
Number of farmers markets in state in 2009 (MD Dept of Ag.) |
100 |
|
Number of markets that accept SNAP EBT cards (MD Dept of Ag.) |
3 |
|
2008 Farmers Markets SNAP Sales (USDA FNS) |
– |
|
2009 Farmers Markets SNAP Sales (USDA FNS) |
$2,126 |
CHALLENGES AND OPPORTUNITIES FOR SNAP FARMERS MARKETS AND STATE AGENCIES
- Most Maryland farmers markets are informal organizations and do not have bank accounts to implement a SNAP program.
- Farmers markets and farmers lack access to start-up capital to purchase the wireless machines.
- Farmers are resistant to adopting SNAP due to lack of knowl- edge about the program as well as reluctance to sign up for additional federal programs (beyond Senior and WIC Farmers Market Nutrition Programs, and, in 2010, the WIC Fresh Fruit 7 Vegetable Voucher).
- State stakeholders need to develop and disseminate informa- tion that illustrates the benefits of SNAP to the farmers.
- Farmers markets do not have the resources to conduct SNAP outreach and promotions to SNAP shoppers. Community partners are often in better positions to conduct SNAP promo- tion programs.
- SNAP programs require education of SNAP shoppers on how to shop at farmers markets (with tokens or paper receipts).
- Community partners are interested in expanding SNAP in farmers markets, and some efforts are underway to formalize partnerships with Maryland Hunger Solutions, faith commu- nities, Maryland Transit Authority, Midshore Economic De- velopment Council, Maryland Extension, and Maryland State Tourism’s “Buy Local” Campaign.INSIGHTS ABOUT MARYLAND FARMERS MARKETS• Most farmers markets are informally managed by the farmers. On an average, farmers markets have six farmers and collect
LEAD CONTACTS:
Amy Crone, Agricultural Marketing Specialist, Maryland Depart- ment of Agriculture
Kay Finegan, Director of Bureau of Policy and Training, Maryland Department of Human Resources
CONNECTING SNAP RECIPIENTS WITH FARMERS MARKETS
68
I.
STATE SYNOPSIS: MICHIGAN
QUANTITATIVE OVERVIEW
• In two Ypsilanti farmers markets and one Kalamazoo farm- ers market, local food co-ops are managing the EBT program. Throughout the state, various organizations are promoting SNAP in farmers markets including anti-hungers groups, extension, faith base communities, MIFMA and Michigan Food Policy Council.
• Atthestatelevel,theEBTdirectorisverysupportiveofimple- menting programs in farmers markets. The dDpartment post- ed the farmers market locations on their website.
• Atthecountylevel,somefarmersmarketsworkcollaboratively with the local DHS offices to provide market education infor- mation. Education tools include targeted SNAP shopper post cards, and banners in local DHS offices.
• The relationship with SNAP Outreach community contrac- tors is just being explored. MIFMA contacted these potential community partners, such as the Center for Civil Justice, who expressed interest in assisting with the farmers market program outreach.
• An estimated 25% of the Michigan’s farmers markets are col lecting a convenience fee to cover the SNAP operating cost. Most farmers markets have covered these costs with farmers market’s general administration funds. The intent of this strat- egy was to demonstrate first the potential increase in farmers sales before charging a SNAP program fee.
• To date, most market managers are uncompensated for the additional time to manage the SNAP programs. Some farmers market have utilized AmeriCorps volunteers to sup- port the program.
• MIFMA sees the complexity of the federal funding programs becoming more of a challenge for farmers and the shoppers. Market managers are concerned that there are too many pro- grams with too many names and too many different ways to implement the programs (see schematic in Chapter IV).
• Michigan DHS wants to implement a WIC EBT pilot pro- gram beginning in September in five farmers markets using iPhones. These five farmers markets currently do not have SNAP capability.
• MIFMA expressed concern about federally funded programs using farmers markets as a distribution point without admin- istrative funding.
• As of early 2010, Michigan had twelve SNAP-only farmers markets and 13 markets which accept SNAP, debit, and credit cards.
LEAD CONTACT:
Dru Montri, Association Manager, Michigan Farmers Market Association
|
Number of farmers markets in state in 2009 (MI FMA) |
217 |
|
Number of markets that accept SNAP EBT cards (MI FMA) |
29 |
|
2008 Farmers Markets SNAP Sales (USDA FNS) |
$137,090 |
|
2009 Farmers Markets SNAP Sales (USDA FNS) |
$280,611 |
CHALLENGES AND OPPORTUNITIES FOR SNAP FARMERS MARKETS AND STATE AGENCIES
- FarmersmarketsneedpaidstafftomanagetheSNAPprogram on market days.
- Statewide farmers markets lacks the capacity to answer and provide one-on-one technical assistance to market about im- plementing their EBT program. A one-size-fits-all approach will not work because of the unique characteristics of each market.
- SNAP shoppers lack transportation options to attend farmers markets.
- Manystatewidefarmersmarketorganizationsdonotpresently have the connections with transportation authorities to ad- dress transportation barriers. Additionally, many transporta- tion decisions are made locally and it is difficult to coordinate advocacy on transportation barriers at a statewide level.
- To increase farmers markets’ interest in implementing SNAP, the state SNAP administration needs to provide free wireless machines from ACS (state SNAP database contractor).
- Expand SNAP incentive programs to increase the number of SNAP shoppers.INSIGHTS ABOUT MICHIGAN FARMERS MARKETS
- Michigan Farmers Markets Association (MIFMA) records show that the total SNAP sales at farmers markets were $150,644 in 2008 and $297,077 in 2009.
- In January 2007, the Michigan Farmers Markets Food Assis- tance Partnership was formed after several key people attended the EBT in Farmers Markets Summit in Iowa. At that time, only three Michigan farmers markets had EBT.
- A proposed study will seek to understand why farmers are committed to selling in farmers markets located in low-income neighborhoods.REAL FOOD, REAL CHOICE
J.
STATE SYNOPSIS: MINNESOTA
QUANTITATIVE OVERVIEW
INSIGHTS ABOUT MINNESOTA FARMERS MARKETS
- Minnesota farmers markets that are located outside urban ar- eas are mainly smaller, volunteer-run organizations averaging 10 farmers. Consequently, statewide, farmers markets show little interest in coordinating SNAP programs.
- The2010MinnesotaFarmersMarketAssociation(MNFMA) annual meeting discussed the amount of federal dollars not be- ing captured in farmers markets around the state. The title of the 2010 conference was “Reaching the Unreachables.”
- In 2009, Minnesota Department of Agriculture secured a one-year Specialty Crop Grant to implement the SNAP program with six farmers and two farmer markets. The one year grant paid for rental machines, merchant service fees, tokens and market- ing materials. Outcomes from the grant were challenged by delayed implementation and the ability to educate SNAP shoppers about their farmers markets shopping opportunities in such a short pilot program.
- The Minnesota Department of Agriculture negotiated the rented wireless machine contracts with one merchant service provider. Misunderstandings about the contract led to the markets being charged monthly fees over and beyond the length of the pilot program.
- Midtown Farmers Market in Minneapolis currently accounts for the majority of the state’s farmers market SNAP sales. They currently collaborate with municipal agencies that ad- minister SNAP and will collaborate with two other Minne- apolis farmers markets to advertise through radio and print media in the 2010 season. The three markets will also imple- ment an EBT matching incentive program this season with financial support from Blue Cross Blue Shield Minnesota and the City of Minneapolis.
- Representatives from the Midtown Farmers Market feel that FNS’ 2009 SNAP figure of $3,458 is probably inaccurately low.LEAD CONTACTS:John Ulland, President, Minnesota Farmers Markets Association (MN FMA)
Amanda Baesler, Minnesota Department of Agriculture
David Nicholson, (Former) Market Manager, Midtown Farmers MarketTikki Brown, Program Administrator, Food Support Outreach and Nutrition Education, Minnesota Department of Human Services
69
|
Number of farmers markets in state in 2009 (MN FMA) |
125 |
|
Number of markets that accept SNAP EBT cards (USDA AMS) |
7 |
|
2008 Farmers Markets SNAP Sales (USDA FNS) |
N/A |
|
2009 Farmers Markets SNAP Sales (USDA FNS) |
$3,458 |
CHALLENGES AND OPPORTUNITIES FOR SNAP FARMERS MARKETS AND STATE AGENCIES
- Farmers markets are reluctant to implement the SNAP pro- grams due to lack of start up capital to purchase equipment and staffing to manage the programs.
- Need effective outreach to encourage SNAP shoppers to be- come regular customers.
- Opinions differ among organizations on whether the farmer- operated or central market-terminals are most effective. The type of program depends on the community setting.
- The SNAP agency believes that funding for advertising and promotion, wireless devices, monthly wireless fees, and addi- tional staffing to implement and monitor the program would make farmers markets a viable food access point for families receiving SNAP benefits.
- The State EBT Director can only provide farmers market plan approval and best practice suggestions to a given market.
- Choose to implement the program with individual farmers where they can see the economic value in both increasing their customer base and increasing their sales through debit and credit cards.
- Need to remove the burden of administration and promotion from resource-scarce farmers markets as they see no way of benefiting directly from implementing SNAP.
- More education is needed to teach SNAP shoppers how to prepare fresh produce.
- Farmersmarketsandcommunitypartnersneedmoreinforma- tion and best practices on how to best to reach SNAP partici- pants to encourage them to shop at farmers markets.
CONNECTING SNAP RECIPIENTS WITH FARMERS MARKETS
70
K.
STATE SYNOPSIS: NEW JERSEY
QUANTITATIVE OVERVIEW
* New Jersey Department of Human Services has provided 25 farmers with wire- less terminals through a two-year pilot program.
CHALLENGES AND OPPORTUNITIES FOR SNAP FARMERS MARKETS AND STATE AGENCIES
- Wireless technology is too expensive for most farmers.
- Need to educate farmers and market managers on SNAP programs.
- Current state budgetary constraints limit the state agencies’ ability to develop trainings and outreach.
- Lack of a coordinated outreach program to educate SNAP shoppers on how to shop at farmers market with their EBT card.
- SNAP shoppers need better transportation options to attend farmers markets.
- Astrongrepetitiveadvertisingcampaignisneededtoattractto SNAP shoppers.
• On-site staff is needed to assist SNAP shoppers.
INSIGHTS ABOUT NEW JERSEY FARMERS MARKETS
- Farmers markets have minimal organization structure so most SNAP sales are generated at the farmer’s level.
- SNAP implementation is often hindered by farmers’ competi- tive interest to protect their sales data and details on how they market their products.
- Farmers organizations are often organized around local brand- ing campaigns such as Jersey Fresh.
- New Jersey does not have a statewide farmers markets organi- zation. The New Jersey Department of Agriculture and the
•
•
•
New Jersey Farm Bureau are the main contact points for farm- ers market technical assistance. Twenty seven farmers markets are listed on the New Jersey Council for Farmers and Com- munities website which is maintained by New Jersey Farm Bureau. The list reflects which farmers markets have ‘Jersey Fresh’ farmers selling their products.
SNAP sales appear high for the number of farmers markets in New Jersey. However, according to the SNAP administrator, there is an unknown number of farmers who use manual vouchers. Also, many farmers travel long distances to capture sales in New York City’s farmers markets.
Inthepast,farmershaveexpressedfrustrationwiththewireless machines. For the farmers to adopt the wireless technology, they need to see an increase in income to justify the increase time it takes to operate the machine and to do the extra book keeping.
Only two of the 25 EBT pilot program farmers chose to offer credit card services.
|
Number of farmers markets in state in 2009 (USDA AMS) |
122 |
|
Number of markets that accept SNAP EBT cards (NJ Dept. of Human Services) |
25 farmers* |
|
2008 Farmers Markets SNAP Sales (USDA FNS) |
$364,745 |
|
2009 Farmers Markets SNAP Sales (USDA FNS) |
$718,121 |
REAL FOOD, REAL CHOICE
LEAD CONTACTS:
Ron Good, Bureau Chief, New Jersey Department of Agriculture Maryanne Scheadel, Manager of Food Stamp and Electronic Benefits Transfer, New Jersey Department of Human Services
L.
STATE SYNOPSIS: NEW MEXICO
QUANTITATIVE OVERVIEW
CHALLENGES AND OPPORTUNITIES FOR SNAP FARMERS MARKETS AND STATE AGENCIES
- Farmers markets lack staffing capacity to implement and pro- mote the program. Market managers are generally volunteers or very low paid, and extremely busy.
- Rural farmers markets have an especially difficult time finding community partners
- There is a need to develop funding for statewide SNAP promotion
- Desire to work towards providing sustainable compensation for farmers market staff.
- Desire to connect rural farmers market with SNAP Outreach programs.INSIGHTS ABOUT NEW MEXICO FARMERS MARKETS
- The New Mexico Department of Human service leases the machines and then provides them to farmers markets at no cost. In addition, they pay for SNAP transactions and monthly service fees. Farmers markets need the state to cover these funds in order to offer SNAP.
- New Mexico Farmers Market Association (NMFMA) has se- cured grants and funding from their state human services de- partment to pay volunteer stipends. For the first time in 2010, the farmers markets will not have this additional funding, which may create fewer volunteers to support the farmers mar- kets’ SNAP programs. Constantly seeking grants is not sus- tainable in the long term.
- New Mexico farmers markets are mainly located in rural com- munities. Many farmers market managers are reluctant to add EBT because of the additional labor.
71
• New Mexico farmers find the tokens cumbersome but do see additional sales generated by the program.
• In the course of this project’s research, a miscoding was revealed in which one New Mexico grocery store SNAP retailer had been coded as a farmers market. When the retailer was removed from the farmers market sales data, FNS’ original report of $171,436 in farmers market SNAP sales was reduced to $12,870.97, a difference of more than 1,200%.
LEAD CONTACT:
Denise Miller, Executive Director, New Mexico Farmers Market Association
|
Number of farmers markets in state in 2009 |
58 |
|
Number of markets that accept SNAP EBT cards |
6 |
|
2008 Farmers Markets SNAP Sales (USDA FNS) |
N/A |
|
2009 Farmers Markets SNAP Sales (USDA FNS) |
$12,871 |
CONNECTING SNAP RECIPIENTS WITH FARMERS MARKETS
72
M.
STATE SYNOPSIS: NEW YORK
QUANTITATIVE OVERVIEW
• Over two years, the Federation, Department of Agriculture and Marketing, and Office of Temporary and Disability As- sistance developed and implemented a statewide promotional plan to increase SNAP sales in farmers markets. This promo- tional plan is unique in its intent to educate the SNAP shopper on the benefits of the SNAP in farmers markets program and how SNAP shopper can participate in the market.
• IncentivefundingfromtheHumptyDumptyFoundationand Wholesome Wave Foundation helped to engage new SNAP shoppers, especially in first year EBT farmers markets. In the past, before the economic downturn, there were conversations with New York Office of Temporary and Disability Assistance (New York’s SNAP agency) to provide incentives.
• One unexpected reaction to the incentive programs was that some SNAP shoppers thought the incentive dollars were taken from their SNAP benefits bank account. One-on-one con- versations with SNAP shoppers and community outreach helped address this fear.
• The farmers market SNAP program must be viewed as an in vestment. Data shows that over time there are increase sales to farmers, increase in new customers and a tremendous amount of goodwill within the community.
• The Federation built a strong collaborative relationship with the state EBT director who provided valuable data to grow the farmers market programs and promoted the program to SNAP shoppers.
• The Federation educated USDA FNS field representatives on the different types of farmers market structures. By increas- ing their knowledge of farmers markets, the Federation and USDA FNS worked collaboratively to find different ways to make farmers markets an EBT food access point.
• Some New York food pantries hold the FNS permit and run the SNAP program at the local farmers markets.
• Farmers now have multiple government programs to manage, including FMNP, WIC Cash Vouchers, Health Bucks and SNAP. The Federation developed a cheat sheet for each ven- dor so they can train personnel on how each program works.
• The Federation and partners does extensive market trainings throughout the state, along with several webinars. The out reach program was funded by FMNP and Department of Health.
LEAD CONTACTS:
Diane Eggert, Farmers Market Federation of New York
Phyllis Morris, New York State Office of Temporary and Disability Assistance
|
Number of farmers markets in state in 2009 (FMFNY) |
450 |
|
Number of markets that accept SNAP EBT cards (FMFNY) |
135 |
|
2008 Farmers Markets SNAP Sales (USDA FNS) |
$197,041 |
|
2009 Farmers Markets SNAP Sales (USDA FNS) |
$595,126 |
CHALLENGES AND OPPORTUNITIES FOR SNAP FARMERS MARKETS AND STATE AGENCIES
- There is a need to build a statewide network of partnerships to help markets administer the program and provide outreach to SNAP clients.
- There is presently a financial shortfall for state level staffing to train markets and promote the SNAP program to both mar- kets and consumers.
- Farmersmarketsneedadditionalcapacitytoeffectivelyadmin- ister SNAP programs.
- TheNewYorkStateSNAPAgencynotedthatbarrierstoSNAP participants shopping in New York markets include: Percep- tion of price, shopping habits, and convenience of market lo- cations, days, and hours.
- State agencies can support markets and connect participants to markets by continuing to fund promotional efforts at the state level (which can impact shopping habits), recognizing the value of incentive programs, and encouraging local and re- gional staff to promote the opportunity to use EBT benefits to SNAP participants on a regular basis. The contact also em- phasized the importance of funding support for markets (both in terms of equipment and staffing) as essential for market success.
- State agencies can also assist markets by participating in com- munity-level partnerships with Extension Service programs, county WIC offices, and non-profits.INSIGHTS ABOUT NEW YORK FARMERS MARKETS
• New York Federation of Farmers Markets documented SNAP sales are substantially more than stated by FNS. In 2008, the Federation shows SNAP sales at $278,689 compared to $197,041. Likewise, in 2009 the Federation SNAP sales were $833,000 versus FNS sales of $595,126.
REAL FOOD, REAL CHOICE
N.
STATE SYNOPSIS: OREGON
QUANTITATIVE OVERVIEW
73
• In 2009, state SNAP bonus dollars provided matching in- centive dollars for farmers markets. The funds were admin- istered through a grant process managed by the Oregon Farm- ers Markets Association. New Seasons grocery store provided additional matching dollars for the Portland Metro-area farm- ers markets. The outcomes showed an increase in SNAP shop- pers’ participation even after the farmers markets discontinued the incentives.
• In 2010, a roundtable of farmers markets, public health lead- ers, and key stakeholders funded by Northwest Health Foun- dation and managed by the Community Health Partnership will share challenges and opportunities to improve consump- tion of fruits and vegetables among at-risk communities through farmers market settings.
• OregonStateUniversityExtensionistheprogrammanagerfor the state’s DHS SNAP-Ed program. Based on the 2000 census data, they determined that 18 Oregon farmers market are lo- cated in communities which meet the 185% of the federal poverty guidelines required to for organizations to be consid- ered for managing SNAP Education programs.
LEAD CONTACT:
Karen Wagner, President, Oregon Farmers Market Association
|
Number of farmers markets in state in 2009 (OFMA) |
115 |
|
Number of markets that accept SNAP EBT cards (OFMA) |
47 |
|
2008 Farmers Markets SNAP Sales (USDA FNS) |
$92,550 |
|
2009 Farmers Markets SNAP Sales (USDA FNS) |
$261,229 |
CHALLENGES AND OPPORTUNITIES FOR SNAP FARMERS MARKETS AND STATE AGENCIES
- Lack of staffing, paid or unpaid, who are committed to the SNAP program.
- Farmers markets’ inability to advocate clearly for SNAP with- out verifiable data.
- Too few resources to offer as support for SNAP/EBT farmers markets.
- NeedforFNStosimplifytheprocessofapplyingforafarmers market SNAP authorization permit.
- Need to study price and value comparisons between farmers markets and other retail stores.
- Need to provide education on preparing fresh, whole foods.
- NeedtoprovideEBT/point-of-salecontractsandcostanalyses that are transparent and honest.INSIGHTS ABOUT OREGON FARMERS MAR- KETS
- MarketmanagerswereverysupportiveofSNAP,whilefarmers were somewhat supportive. However, there is a distinction that needs to be made between “supportive” and “invested.” Micro and small farmers markets do not feel able to take on the risk of implementing SNAP.
- Mostfarmersmarketschargeaconveniencefeetodebitand/or credit customers to cover operating costs.
- Laborforimplementingprogramistypicallypaidfromafarm- ers market’s general operating funds and/or the volunteers re- cruited to manage the program.
CONNECTING SNAP RECIPIENTS WITH FARMERS MARKETS
74
O.
STATE SYNOPSIS: PENNSYLVANIA
QUANTITATIVE OVERVIEW
• Food Trust initially implemented the program at the market level using a paper receipt process. In 2008 they received a grant to provide rented machines to 21 farmers. During this pilot program, The Food Trust paid for the rented machines, SNAP transaction fees, and monthly fees. This costed the or- ganization up to $3,500 during the pilot program (exclusive of staff time). Though farmers embraced EBT transactions, they stated it would be unlikely that they would undertake the wireless machine cost themselves. After the pilot program, The Food Trust returned to a central-market SNAP model in their farmers markets.
• DuringtheFoodTrustpilotprogram,onethirdofSNAPcard users were new customers to the market, and the average SNAP shopper spent between $15 – $17 per visit.
• If USDA sales figures are correct, The Food Trust accounted for 70% of 2009 farmers market SNAP sales ($14,452), when they operated SNAP in 20 farmers markets.
• Food Trust partners with community development corpora- tions to support SNAP programs in farmers markets.
• In 2009-2010, Pennsylvania’s Farmers Market Alliance was discontinued. However, Pennsylvania State University Exten- sion has taken steps to help facilitate the development of a new statewide farmers market association.
• Pennsylvania’s Southern Capital Rural Conservation and De- velopment Area Council received a USDA Farmers Market Promotion Program Grant to provide 14 farmers markets with wireless machines.
LEAD CONTACTS:
Jon Glyn, Market Manager, Food Trust, Philadelphia, PA Megan Cook, Former Director of the Farmers Market Alliance of Western Pennsylvania
Donna Roe, Pennsylvania Department of Public Welfare
|
Number of farmers markets in state in 2009 (USDA AMS) |
161 |
|
Number of markets that accept SNAP EBT cards (USDA AMS) |
16 |
|
2008 Farmers Markets SNAP Sales (USDA FNS) |
– |
|
2009 Farmers Markets SNAP Sales (USDA FNS) |
$20,646 |
CHALLENGES AND OPPORTUNITIES FOR SNAP FARMERS MARKETS AND STATE AGENCIES
- Farmers markets lack funding for wireless machines and out reach to SNAP shoppers.
- ShoppersneedmoreSNAPfarmersmarketsintheareatowar- rant a larger SNAP farmers market promotional campaign.
- SNAP sales are not significant enough for farmers to cover the start-up costs themselves.
- Farmersmarketsneedstafftomanagetheprogramatthemar- ket and maintain a consistent accounting system.
- The USDA Food and Nutrition Service’s SNAP application process is challenging.
- Need to create a farmers market manager how-to guide detail- ing the steps to implement SNAP in farmers markets.
- The government should subsidize the cost of wireless technol- ogy as they do for hard-wired machines provided to SNAP retailers.
- More clever and efficient marketing strategies should be used to reach SNAP shoppers.
- Agencies and grantmakers should require that all sponsored markets accept SNAP.INSIGHTS ABOUT OREGON FARMERS MAR- KETS
- The current USDA data on the number of SNAP farmers markets is not accurate, considering Food Trust alone has 22 EBT farmers markets.
- In 2008, Food Trust SNAP sales breakdown was 1% SNAP, 4% debit and/or credit and the balance cash sales.
REAL FOOD, REAL CHOICE
P.
STATE SYNOPSIS: TEXAS
QUANTITATIVE OVERVIEW
75
|
Number of farmers markets in state in 2009 (USDA AMS) |
105 |
|
Number of markets that accept SNAP EBT cards (USDA AMS) |
5 |
|
2008 Farmers Markets SNAP Sales (USDA FNS) |
$11,572 |
|
2009 Farmers Markets SNAP Sales (USDA FNS) |
$50,163 |
CHALLENGES AND OPPORTUNITIES FOR SNAP FARMERS MARKETS AND STATE AGENCIES
• Farmers Markets need more training on how to implement EBT technology in farmers markets.
INSIGHTS ABOUT TEXAS FARMERS MARKETS
- The Texas Certified Farmers Market Association represents 55 farmers markets. Farmers market managers organized the as- sociation to maintain the integrity of the farmers market orga- nizations by eliminating resellers in farmers markets.
- AccordingtothePresidentoftheFarmersMarketAssociation, Texas’s average farmers market is 15 farmers.
- Texas Certified Farmers Market Association was unaware of the Farmers Market Coalition prior to this research. They ex- pressed interest in joining and learning from other farmers markets.
- At the Association’s 2010 conference, three farmers markets indicated that they currently have EBT. Other members were eager to adopt wireless technology in their market but had little information on how to adopt EBT in farmers markets.
- Texas is one of two states piloting a WIC EBT program, through their state WIC office. The Department demonstrat- ed the system at the farmers market conference.
- Texas Certified Farmers Market Association wants to assist farmers markets in adopting wireless technology but feels a need to better understand the various options for implement- ing the program.LEAD CONTACTS:Cal Brints, President, Texas Certified Farmers Market Association Kay Jones, Texas Health and Human Services Commission
CONNECTING SNAP RECIPIENTS WITH FARMERS MARKETS
76
Q.
STATE SYNOPSIS: VERMONT
QUANTITATIVE OVERVIEW
• Although the Vermont Agency of Agriculture is supportive of the farmers market EBT program, recent budget cuts have di- rected resources to more regulatory responsibilities. However, the agency does help promote SNAP in farmers market through their media connections.
• By continuing to secure grants, NOFA-VT provides a wireless machine, tokens, a banner, training materials, staffing and promotional support, and coverage of machine service fees for up to three seasons for farmers markets through a competitive grant program.
• The governor allocated $10,000 through the agriculture agen- cy as a goodwill gesture to support EBT in Vermont farmers markets in 2009.
• The Resource and Conservation Development councils and ARRA grants provided additional funding for the SNAP in farmers market programs.
• NOFA-VThasalsoworkedtosecureadditionalfundsthrough private foundations (including Wholesome Wave Foundation’s Double Dollars Program), and Specialty Crop grants.
• NOFA-VT makes some resources on SNAP/EBT available through their web site.
• Market managers, committed vendors, dedicated organiza- tional support, and market volunteers all contribute to the SNAP in farmers markets programs.
LEAD CONTACT:
Jean Hamilton, Direct Marketing and Community Food Security Coordinator, Northeast Organic Farmers Association/Vermont Farm- ers Market Association
|
Number of farmers markets in state in 2009 (VFMA) |
80 |
|
Number of markets that accept SNAP EBT cards (VFMA) |
16 |
|
2008 Farmers Markets SNAP Sales (USDA FNS) |
$6,500 |
|
2009 Farmers Markets SNAP Sales (USDA FNS) |
$36,000 |
CHALLENGES AND OPPORTUNITIES FOR SNAP FARMERS MARKETS AND STATE AGENCIES
- Farmers markets lack capacity to do the additional SNAP pro- gram bookkeeping.
- Farmers markets are unable to secure adequate staffing to run the EBT machines on market days.
- Many Vermonters perceive farmers markets as mostly for the elite.
- More outreach is needed to improve the perception of afford ability and community access to farmers market.
- Farmers market organizations should promote the idea that EBT technology is good for everyone.INSIGHTS ABOUT TEXAS FARMERS MARKETS
- In 2010, Vermont has 27 SNAP EBT farmers markets.
- In 2010, Vermont has 27 SNAP EBT farmers markets.
- In 2007, the Northeast Organic Farming Association of Ver- mont (NOFA-VT) secured a USDA Farmer Market Promo- tional Program grant to implement SNAP in three farmers markets. Additional farmers markets came on board in the grant’s 2nd year. NOFA-VT developed a working group to manage the project that included representatives from VT’s two Resource Conservation and Development Councils, VT Campaign to End Childhood Hunger, VT Department for Children and Families (including the EBT Director and FMNP Coordinator), Vermont Agency of Agriculture, and NOFA-VT.
- NOFA-VT acts as an umbrella organization for the newly de- veloping Vermont Farmers Market Association.
REAL FOOD, REAL CHOICE
R.
STATE SYNOPSIS: WASHINGTON
QUANTITATIVE OVERVIEW
77
ers markets. If such relationships were to be facilitated at the community-level, there could be great potential to develop joint education efforts to attract SNAP shoppers to farmers markets.
The FMTIP program advisors chose one wireless provider for all 20 farmers market grantees. Unfortunately, the selected merchant service provider did not have the proper software to transfer funds from SNAP participants’ account to the farmers markets’ bank accounts. In mid-August, the FMTIP program manager had no option but to switch providers. Dur- ing that time, farmers markets had to process all cards as credit or no pin debit transactions, and all EBT transactions had to be manually processed. Despite this rocky beginning, sales in the farmers markets exceeded the farmers markets expectations.
Farmers markets’ booth fee structures vary statewide, with some being a percentage of the farmers’ sales and some a flat fee. Many chose to charge farmers an additional 3% fee on debit and credit card sales to cover the season’s wireless service costs. However, three farmers markets elected to absorb the processing fees rather collect fees from the farmers.
Staff and bookkeeper time was all volunteered or absorbed by the by the farmers market staff. Markets stated that such staff- ing arrangements were not sustainable in the long term.
Poulsbo Farmers Markets decided to not charge 3% fee, but rather gamble that the increase sales in their market as whole would cover the wireless services operating cost. At the end of the season, the bookkeeper confirmed the additional sales did cover the wireless merchant operating cost.
The Vancouver Farmers Market manager viewed the wireless service program dollars well spent when compared to advertis- ing dollars. With the wireless service program, he could dem- onstrate to his board a direct impact on farmers through in- creased sales.
|
Number of farmers markets in state in 2009 (WSFMA) |
140 |
|
Number of markets that accept SNAP EBT cards (WSFMA) |
45 |
|
2008 Farmers Markets SNAP Sales (USDA FNS) |
$46,349 |
|
2009 Farmers Markets SNAP Sales (USDA FNS) |
$142,759 |
•
CHALLENGES AND OPPORTUNITIES FOR SNAP FARMERS MARKETS AND STATE AGENCIES
- Lack of staff and volunteers at the farmers market level to sus- tain some SNAP programs.
- Lack of funding for additional bookkeeping to track tokens and reimburse farmers.
- Transaction and monthly fees need to be subsidized in some farmers markets.
- SNAP shoppers in Washington perceive farmers markets as more expensive and less convenient than grocery stores (due to limited market days and hours).
- SNAP Agency perceives a primary barrier in that the SNAP recipients are often not aware that local farmers accept SNAP benefits.
- Opportunities for the SNAP Agency to address the challenges include: Distributing information about markets that accept SNAP on websites and increasing partnerships between local SNAP offices and markets.INSIGHTS ABOUT TEXAS FARMERS MARKETS
- The Farmer Market Technology Improvement Projects (FM- TIP) funding goals were: 1) increase food access for SNAP shoppers, and 2) increase the sales for farmers. Consequent- ly, the program required the 20 farmers markets grantees to offer SNAP, debit and credit card services. Upon the grant completion, the farmers markets could individually determine if they would offer all three services long term.
- The FMTIP enhanced the Washington State Farmers Market Association’s (WSFMA) relationship with their state SNAP agency. However, this state-level collaboration was not fully reflected the first year between the local DHS office and farm-
•
•
•
•
LEAD CONTACTS:
Jackie Aitchison, Executive Director, Washington State Farmers Mar- kets Association (WSFMA)
Rita Ordonez, Program Manager, Washington Farmers Market Technology Improvement Program
John Camp, Administrator of Food Assistance Programs, Washington Department of Social and Health Services
Future Washington Department of Social and Health Service direct contact for farmers markets:
Arjean Travis, EBT/EFT Administrator, Washington Department of Social and Health Services
CONNECTING SNAP RECIPIENTS WITH FARMERS MARKETS
78
REAL FOOD, REAL CHOICE
COMMUNITY FOOD SECURITY COALITION
3830 SE Division Portland, OR 97202 503-954-2970 www.foodsecurity.org
FARMERS MARKET COALITION
PO Box 331
Cockeysville, MD 21030 410-667-0583 www.farmersmarketcoalition.org


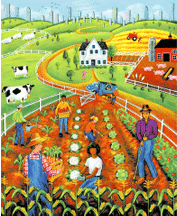 I create content related to healthy aging through fitness, diet and supplements.